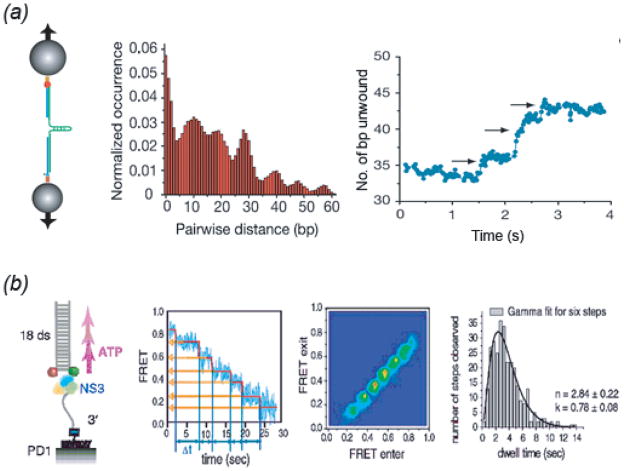
Fig. 4. Single Molecule Studies on Helicase Step Size.
(a) From (Dumont et al., 2006). (left) Optical tweezer setup to monitor NS3 helicase unwinding of an RNA hairpin (see Fig. 2h); (center) Pairwise distance distribution for unwinding extension time traces reveals an 11 ± 3 bp periodicity in pausing during extension. (right) Unwinding substeps of 3.6 ± 1.3 bp that appear within the 11 bp step observed at limiting ATP concentrations. (b) From (Myong et al., 2007). (far left) Experimental smFRET setup to measure NS3 unwinding of 18 bp partial duplex DNA; (mid-left) FRET unwinding time trace fit to step-finding algorithm quantitates FRET values and dwell times for six steps; (mid-right) Total Density Plot representing two-dimensional histograms for pairs of FRET values entering and exiting each transition reveals six peaks; (far-right) Gamma distribution fitting to collected dwell times at each plateau pause reveals three irreversible steps within the 3 bp step indicating 1 nt elemental step size within each 3 bp transition. See text for further details.

