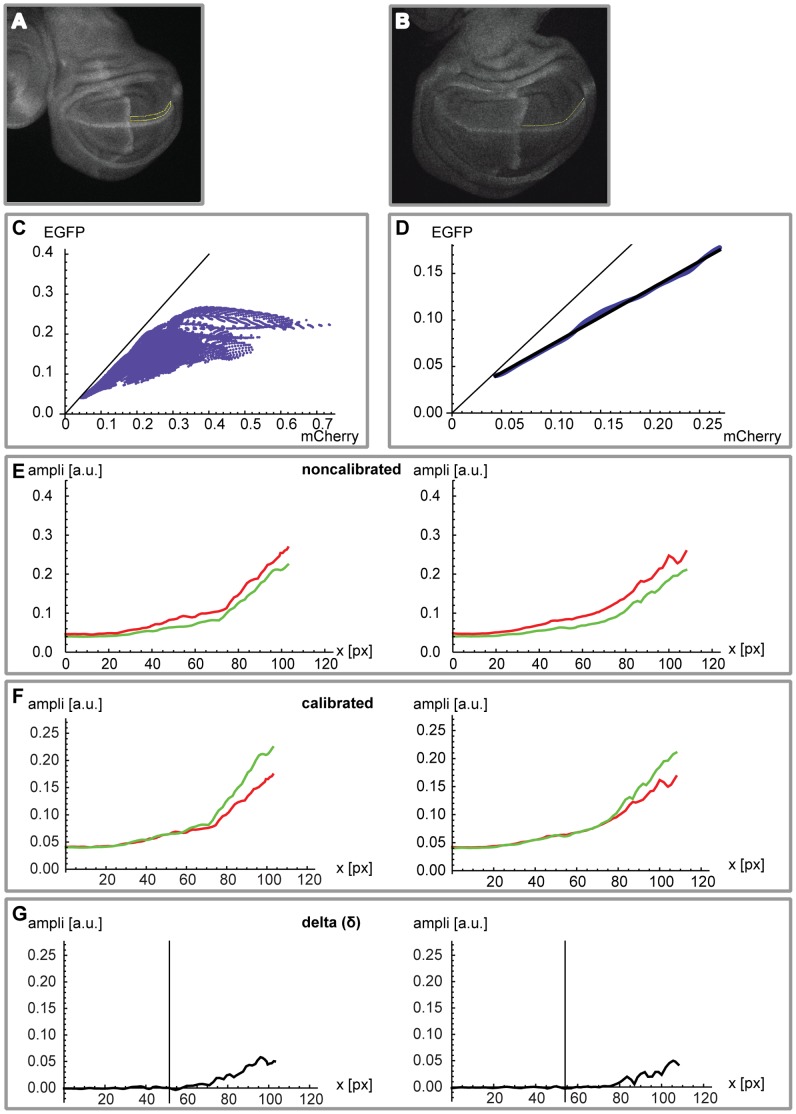
Figure 3. Calibration of EGFP and mCherry wild type profiles.
(A) Example of a 2D mask along the wingless expression domain in the posterior compartment of the pouch used to extract EGFP and mCherry pixel amplitude pairs. (B) Example of a 1D ROI used for profile extraction. The line was manually drawn parallel to the wg expression domain, around ten pixels into the dorsal compartment. (C) All the pixel pairs (absolute fluorescence mCherry versus EGFP) collected from the 2D mask (cf. A), resulting in a cone-shaped distribution. Data for all analyzed allSEwt>EGFP>brk-tags discs (n = 35) was pooled prior to analysis. (D) In black, the calibration profile obtained by a linear fit of the cleaned data (cf. Text S1 for more details). (E) Two representative allSEwt>EGFP>brk-tags (green) versus allSEwt>mCherry-CAAX>brk-tags (red) profiles (absolute values, expressed in arbitrary units) for the posterior half of the pouch prior to calibration. Overall, the mCherry profiles show higher levels than the EGFP profiles. The distance (x-axis) is always expressed in pixels (1 px = 0.664 µm). (F) Same profiles as in (E), after application of the calibration to the mCherry curves (the EGFP profiles remain unchanged). The profiles become quite similar in the medial region of interest. (G) Finally, we plot the difference δ = EGFP – mCherry. As expected, values are close to zero in the medial region (medial 50% of the posterior part of the pouch; marked by vertical line).

