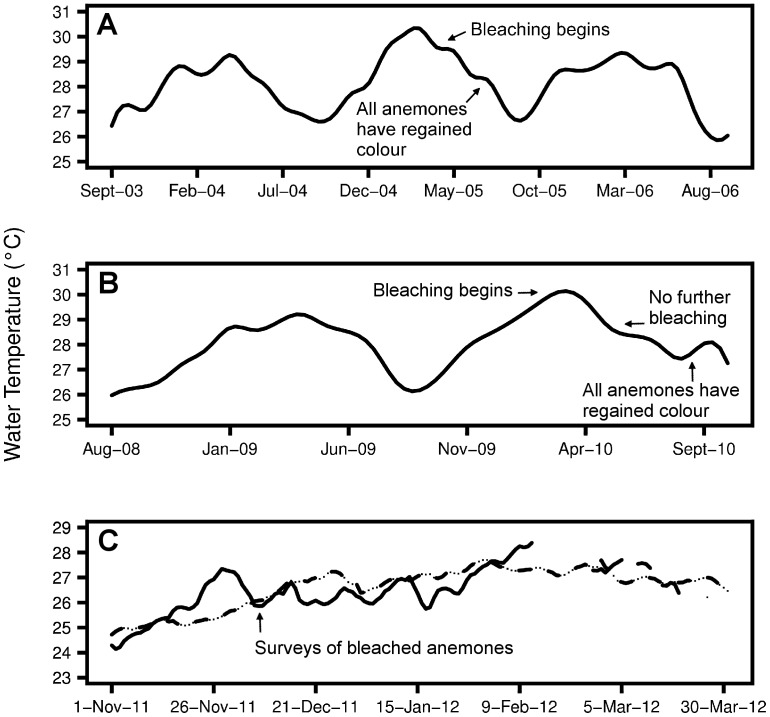
Figure 2. Seawater temperature during anemone bleaching events.
(A) Archival sea surface temperature for Christmas Island obtained from Daily Optimal Interpolation dataset ([34] available at http://coastwatch.pfeg.noaa.gov). in situ measurements of water temperature at (B) 11 m depth at Christmas Island and (C) at 6 m depth at Keppel Islands, based on Australian Institute of Marine Science data. These temperature datasets coincide with major bleaching events at (A) Christmas Island 2005, (B) Christmas Island 2010 and (C) Keppel Islands 2011. For the Keppel Islands (C), the dotted-dashed line represents the summer average (2007–2011), while the solid line represents the 2011–2012 summer. The survey period (December 2011) is indicated with an arrow. Temperature data were unavailable for short periods in February and March 2012.

