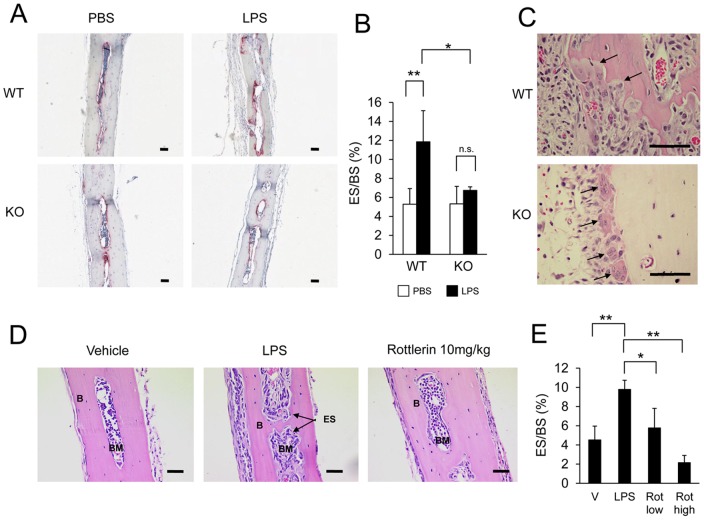
Figure 3. PKC-δ deficiency protects against LPS-induced osteolysis.
(A) Representative TRAP stained histological sections of calvarial bone from WT and PKC-δ KO mice seven days post-injection with Phosphate Buffered Saline (PBS) or Lipopolysaccharide (LPS). (B) Bone eroded surface quantified by bone histomorphometry (n = 4). (C) H&E stained sections of LPS-treated calvaria. Active bone resorbing WT osteoclasts and unattached inactive KO osteoclasts are indicated by arrows. (D) H&E stained sections of WT mice (n = 4) seven days post injection with either Vehicle (V), Lipopolysaccharide (LPS), LPS with 2 mg/kg Rottlerin (Rot low) or LPS with 10 mg/kg Rottlerin (Rot high). (E) Bone eroded surface of Rottlerin treated bone quantified by bone histomorphometry. Unshaded bars in bar charts denote vehicle injections, shaded bars denote LPS injections. Bar charts represent mean ± standard deviation. Scale bar represents 100 μm. *, p-value <0.05. **, p-value<0.01, n.s., no significance (p-value>0.05).

