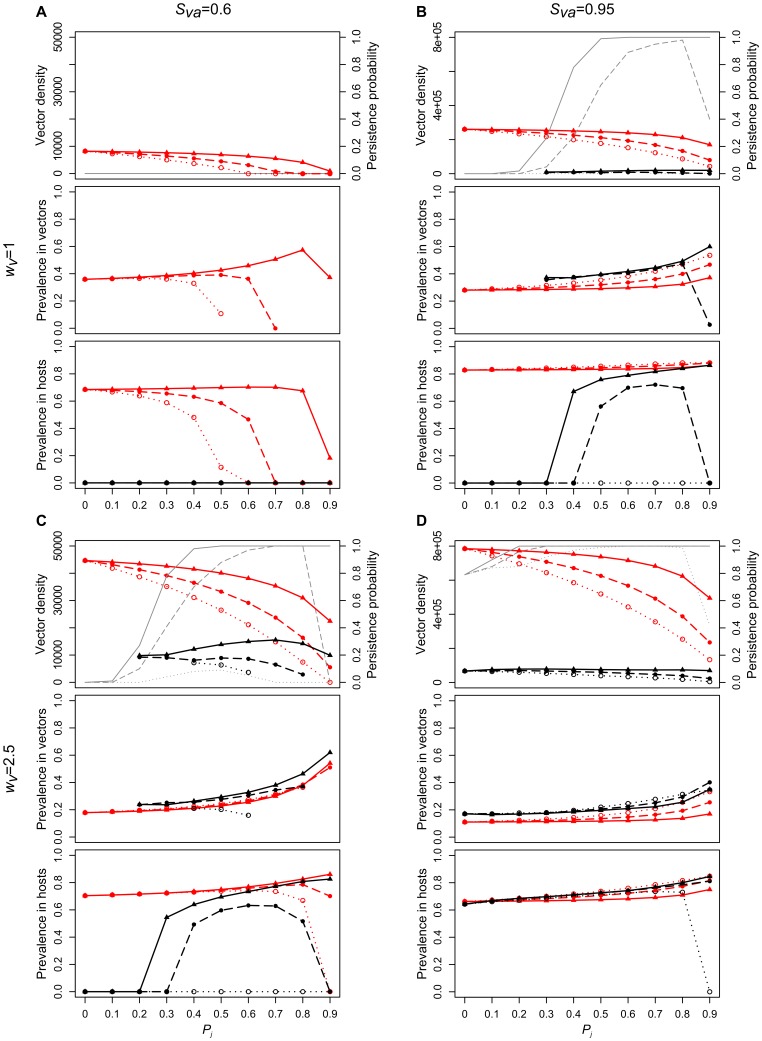
Figure 2. Influence of vector life-history traits on vector population dynamics and parasite prevalence.
In each panel, the upper, middle and lower graphs display, respectively: total vector density, parasite prevalence in vectors, and parasite prevalence in hosts, according to the proportion of juvenile vectors prolonging the juvenile stage Pj. Red and black lines correspond, respectively, to simulation results in the deterministic (shown at t = 150,000 weeks) and stochastic (shown at t = 10,000 weeks as median values over the 100 simulations, plotted only if the number of simulations without extinction is ≥5) case; dotted lines (open circles), dashed lines (closed circles) and solid lines (triangles) to a relatively low (Svj = 0.6), intermediate (Svj = 0.8) and high (Svj = 0.95) juvenile survival. Left and right panels correspond, respectively, to a relatively low (Sva = 0.6; panels a, c) and relatively high (Sva = 0.95; panels b, d) adult survival; upper and lower panels to a relatively low (wv = 1; panels a, b) and relatively high (wv = 2.5; panels c, d) fecundity. The persistence probability of vector populations (proportion of simulations for which vector density does not collapse before the end of the simulation), is given in grey in the upper graphs showing vector density. For prevalence among hosts, all simulations (including those for which vector populations collapse) are taken into account. For vectors (density and prevalence), only simulations for which vector population persisted until the end of the simulation are considered. Other parameters values are: αr = 0.008, β = 0.005, c = 0.01, Shs = 0.994, wh = 0.05, g = 100, q = 50, bmax = 1, ρ = 0.5, pb = 0.2, εS = 0.1.

