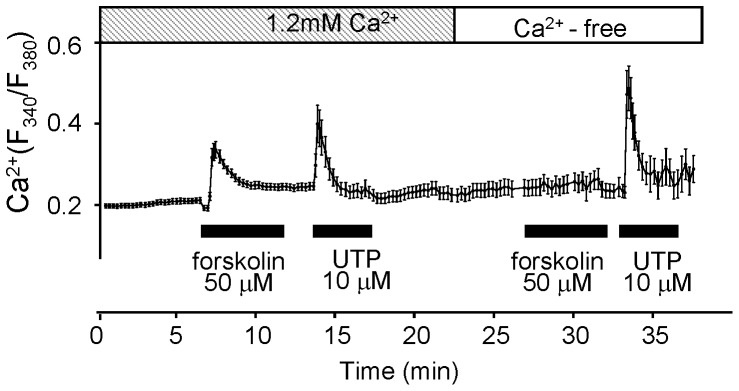
Figure 3. Ca2+-mobilization in H295R under 1.2 mM extracellular Ca2+ or Ca2+-free conditions.

Shown is an averaged trace of the Ca2+-mobilization by forskolin and UTP in H295R under 1.2 mM extracellular Ca2+ or Ca2+-free conditions. The data were represented by the ratios of the fluorescent intensity (F340/F380). Each agonist was applied during the period indicated by solid bars. Each point with an error bar on the line represents the Mean±SD (N = 6).
