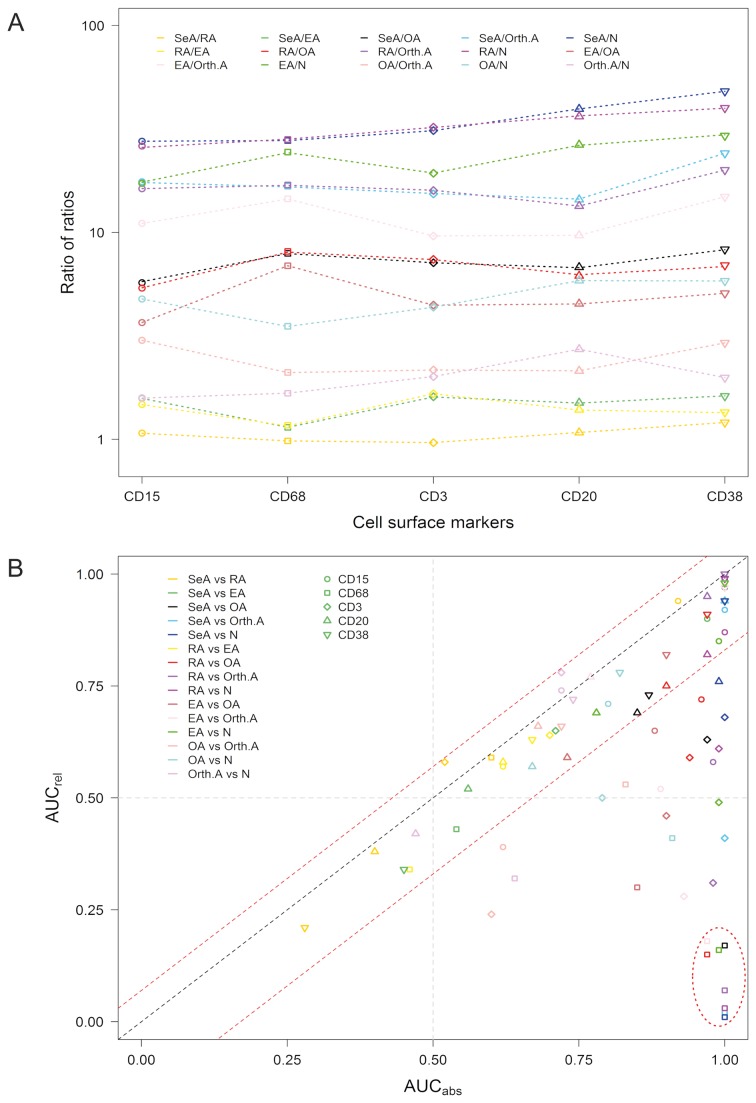
Figure 4. Differences in discriminatory power between the approaches using either the absolute or the relative cell densities.
A. Ratio of ratios. Strip chart (1-dimensional scatter plot, log10[y]) illustrating discrepancies between the absolute and the relative values in terms of quantitative differences (expressed as ratios) within paired comparisons among the sample groups. Separately for the absolute and the relative values, and for each of the five markers, ratios of expression values were computed for all of the 15 possible paired comparisons among the 6 sample groups, with the presumably more inflamed arthropathy constituting the numerator, resulting in separate expression ratios for the absolute and relative cell densities. Using trimmed means, the ratio of ratios was obtained by the formula: (absolute density(group 1) / absolute density(group 2)) / (relative density(group 1) / relative density(group 2)). B. Scatter plot illustrating differences in the discriminatory ability of the relative cell densities (y-axis) compared with the discriminatory ability of the absolute cell densities (x-axis). Each data point (symbol) corresponds to the area under the curve (AUC) for the discriminatory power of one marker within one of the 15 possible pairs of sample groups. AUCs were obtained with binary ROC analysis (Table 2). The black line, intercepting the origin, defines all markers where the absolute and relative methods yield identical AUCs. The red lines (with y-intercept equal to 0.07 and -0.17) define threshold bounds, values beyond which define scenarios in which discrepant AUCs resulted when the absolute and the relative cell densities were used (see legend to Supplemental Fig. S1 for details). The symbol shapes identify the markers used, and the symbol colors the sample group pairs to be differentiated, as detailed in the legends inside the graph. The oval line in the lower right quadrant identifies the paired comparisons in which using the relative cell densities resulted in a reversal of the positive state in the ROC analysis (only data points with significant AUCs [p <0.05, 95% CI not crossing the midline; Supplemental Table S4] were included).

