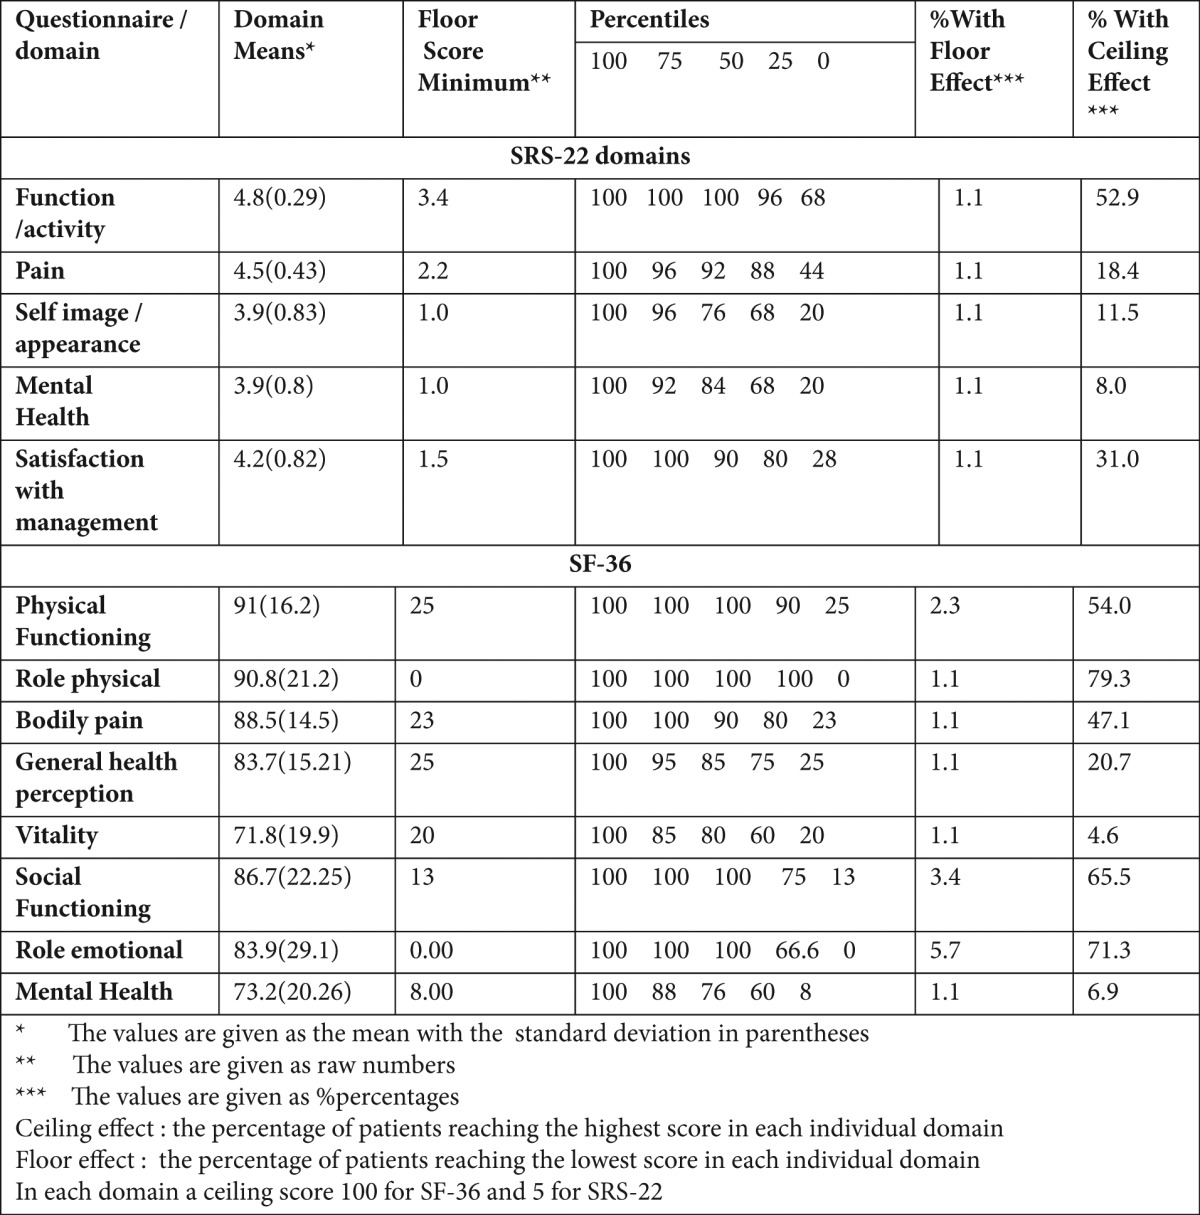
Table 3. Descriptive Statistics on Individual Domain Scores (n=87).

* The values are given as the mean with the standard deviation in parentheses
** The values are given as raw numbers
*** The values are given as %percentages
Ceiling effect: the percentage of patients reaching the highest score in each individual domain
Floor effect: the percentage of patients reaching the lowest score in each individual domain
In each domain a ceiling score 100 for SF-36 and 5 for SRS-22
