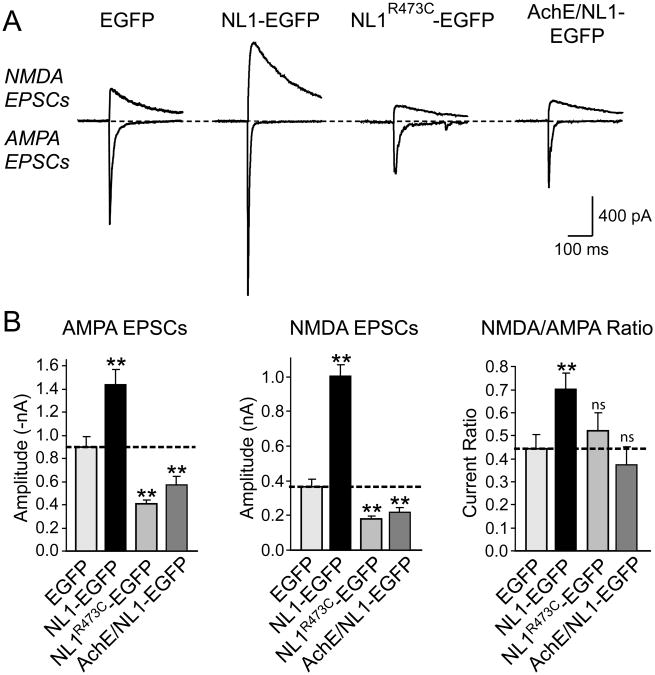
Figure 7. Autism mutation of NL1 causes dominant-negative suppression of EPSCs.
(A) Representative traces of NMDA- (top) and AMPA-receptor dependent EPSCs (bottom). For a diagram of the mutants and a morphological analysis of the effect of the mutants on synapse density, see Suppl. Fig. 4. (B) Mean amplitudes of NMDA- and AMPA-receptor dependent EPSCs and mean NMDA/AMPA receptor ratios. Data shown are means ± SEMs (n=18 neurons from 3 cultures); asterisks indicate that a condition exhibits a statistically significant difference from the EGFP-only transfected control condition (* =p<0.05; **=p<0.01).

