
Figure 5.
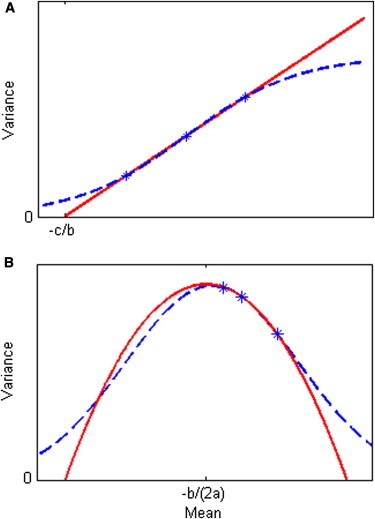
Different Functions that Can Be Fitted to Three (Mean, Variance) Points
The solid curves are the functions shown in Figure 2. Panels (A) and (B) correspond to Figures 2A and 2D, respectively. The dashed curves are a cumulative logistic function in (A) and an exponentiated quadratic in (B). Because these functions are always positive, a corresponding approximate variance-stabilizing transformation is theoretically available for all x (an analytical solution to the integral is possible for the function in [B], but not for that in [A]).