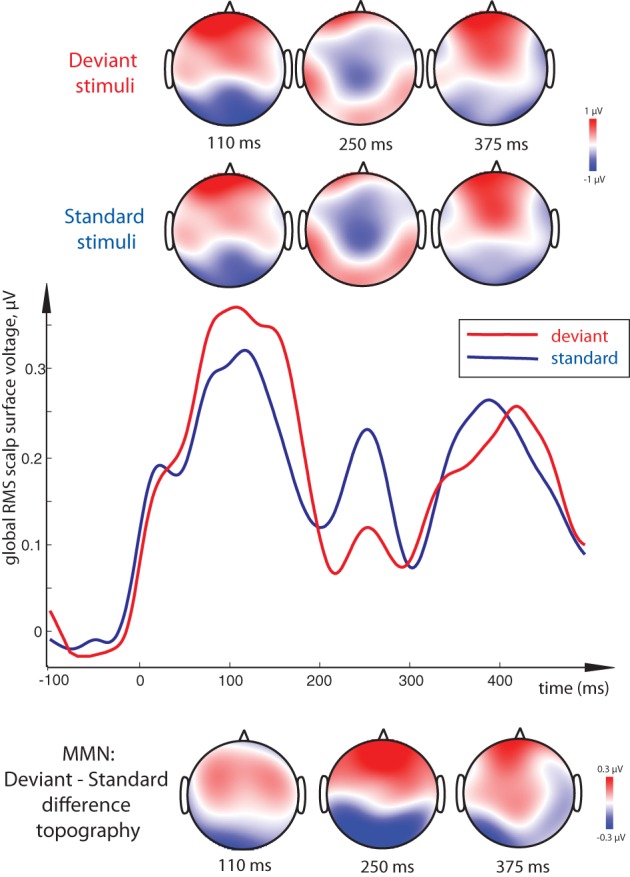
Figure 4.

Visual Mismatch Negativity effect: global RMS of standard and deviant responses to word and pseudoword stimuli (middle), and surface topography of standard and deviant responses (top) and of their difference (vMMN, bottom). Standard-deviant contrast (vMMN) was most significant at 100–120 ms and 240–260 ms peak intervals, and is seen as a bipolar distribution with posterior negativity and frontal positivity. As the standard-deviant contrast did not interact with lexicality and the vMMN did not distinguish between conditions, data from both word and pseudoword conditions are pooled together for this display. Timecourse of activity elicited by the orthographic stimuli shown here has been subtracted by that in the sensory baseline control condition.
