
Figure 3.
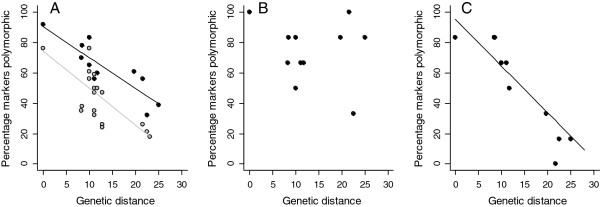
Percentage of CAM (black) and TG (grey) microsatellite markers polymorphic in relation to genetic distance from zebra finch. A: All 24 CAM markers included (CAM = this study; TG = Dawson et al. [21]); B: Six CAM markers with 100% primer sequence similarity to chicken (and zebra finch); C: Six CAM markers with poor primer sequence similarity to chicken (but 100% identical to zebra finch). Percentage markers polymorphic, proportion of loci polymorphic of those amplifying for each set of loci (CAM and TG sets). Genetic distance, DNA:DNA Δ Tm hybridisation distance [33]. Four individuals were genotyped at 24 loci for each of the 11 species (including zebra finch Taeniopygia guttata but excluding chicken Gallus gallus; see text).