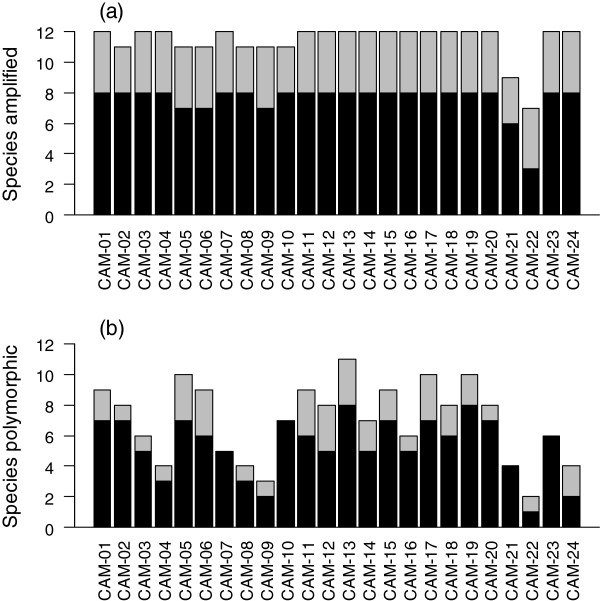
Figure 5.
Number of species (A) amplified and (B) polymorphic at each individual CAM locus. Black bars represent passerines and grey bars non-passerines. Each locus was tested in 12 species (including zebra finch Taeniopygia guttata and chicken Gallus gallus), which included 8 passerine species, and 4 non-passerine species. Classification of species as passerine or non-passerine was following Sibley & Monroe [25]. The data presented is based on the genotyping of 4 individuals per species. For details of which species failed to amplify see Additional file 1.

