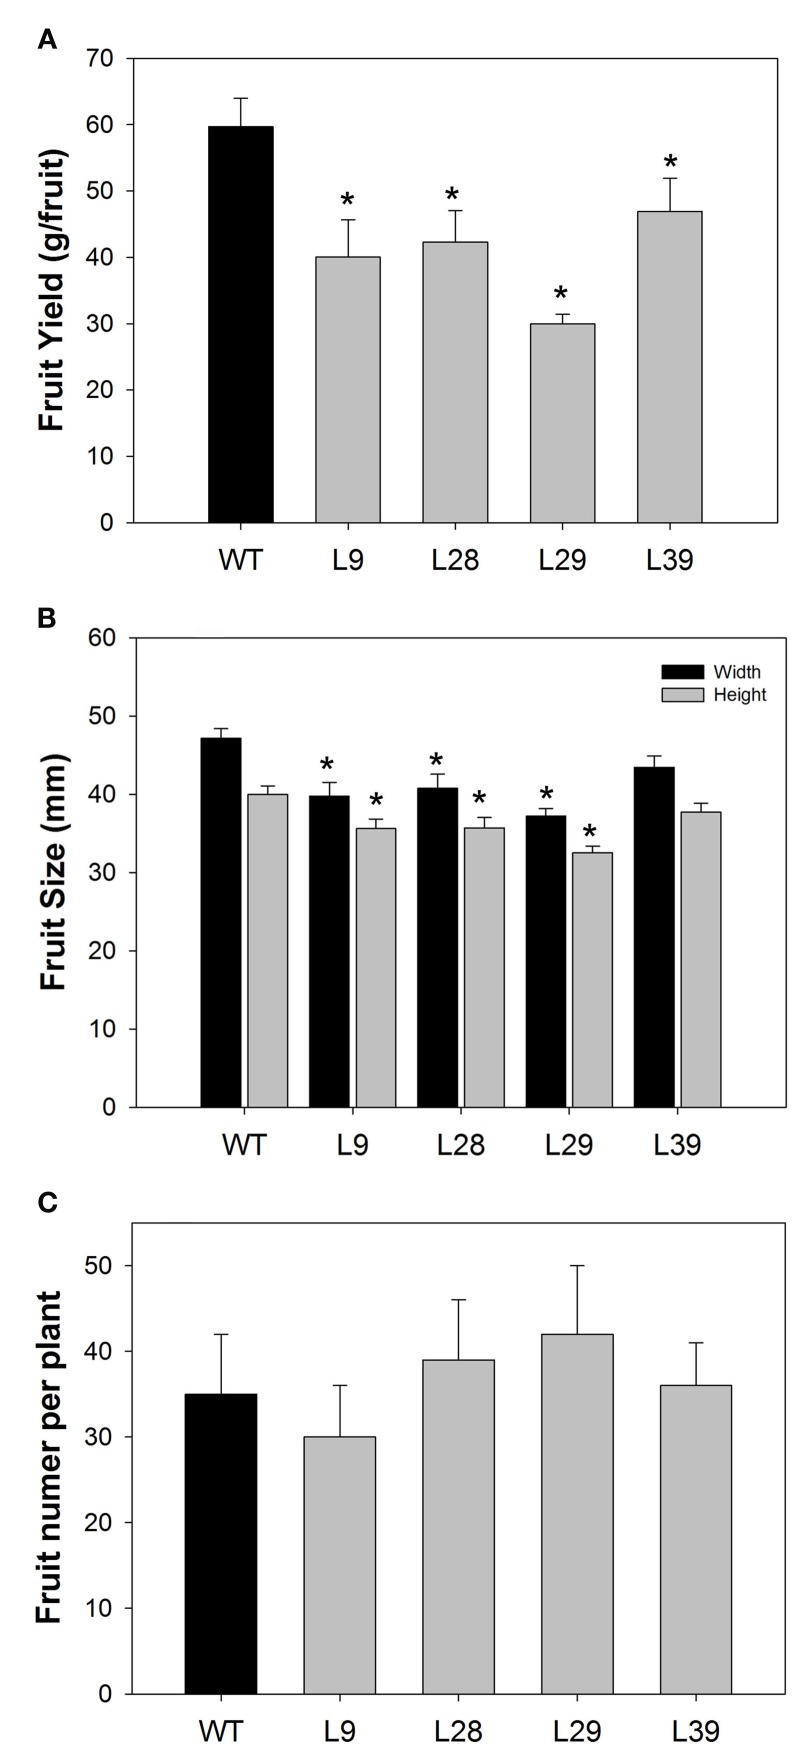
Figure 2.
Characterization of B33-PPi tomato lines. (A) Fruit yield (g per fruit), (B) fruit size, and (C) total fruit number of B33-PPi lines. All measurements were done in red stage (60 DAP). For all parameters, values are presented as the mean ± SE of eight biological replicates (one biological replicate is represented by one individual plant). An asterisk indicates the values that were determined by the t-test to be significantly different (P < 0.05) from wild type.

