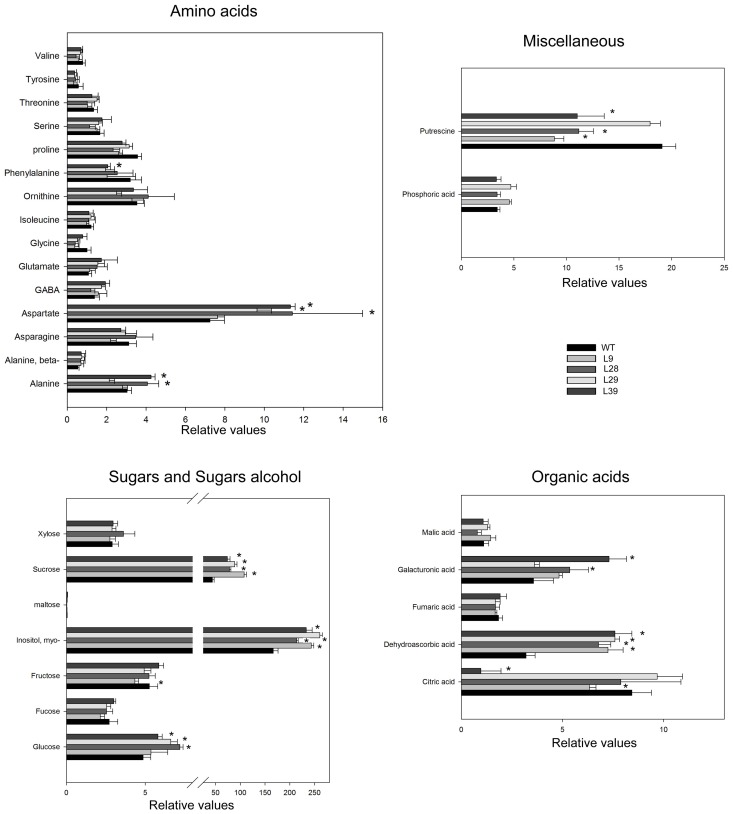
Figure 4.
Primary metabolite levels in the receptacle of WT and B33-PPi lines at red stage. Data are normalized to the mean value of WT at the G stage. Values are means SE of six replicates. Asterisks indicate significant differences by t-test (P < 0.01) of the transgenic lines compared with WT at red stage.

