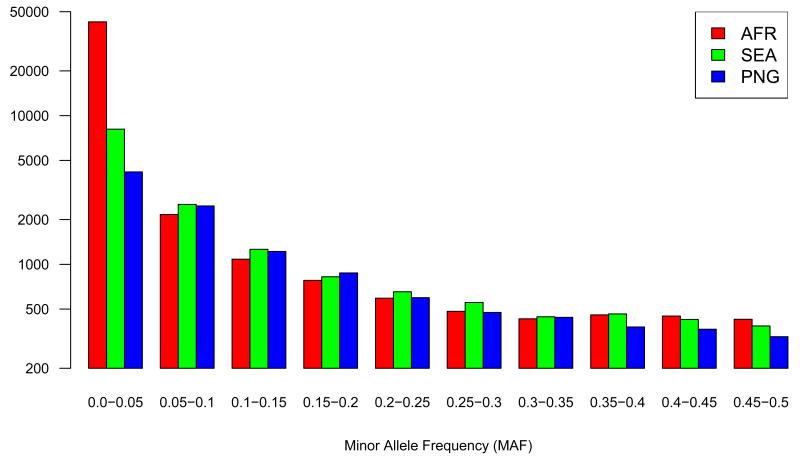
Figure 1.
(a) Minor allele frequency distribution of 86k SNPs set in samples from different continents (AFR, SEA and PNG). Vertical axis shows the number of SNPs in each category of allele frequency. Supplementary Figure S7 shows the data corrected for sample size (b) Considers SNPs that are private to either AFR, SEA or PNG, showing the ratio of nonsynonymous to synonymous substitutions (vertical axis) as a function of derived allele frequency (horizontal axis)


