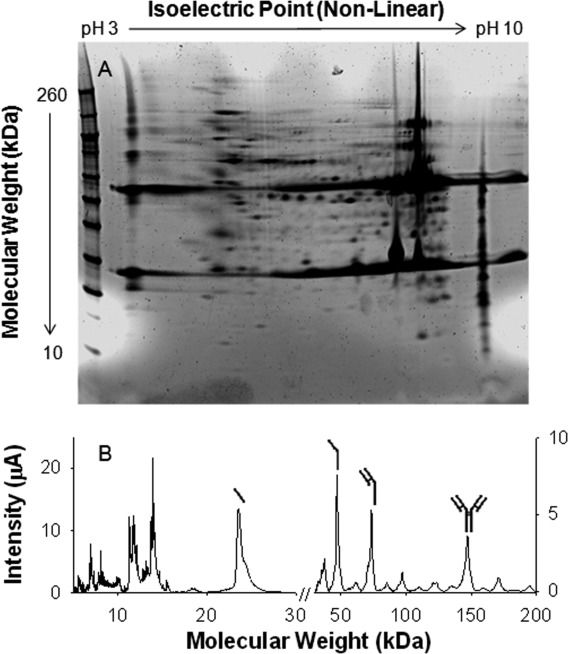
Figure 4. Representative example of a 2D-PAGE gel image (A) and SELDI-TOF MS spectra (B), from the fed-batch culture operated at 37°C.

For 2D-PAGE, pH 3–10 nonlinear IPG strips and 4–12% Bis-Tris SDS-PAGE gel were used, with a total protein load of 200 µg. All samples were run in triplicate and stained with Sypro Ruby. For SELDI-TOF MS, analysis was performed using normal phase chips, with all samples run in triplicate. Peaks attributed to be product related species are indicated.
