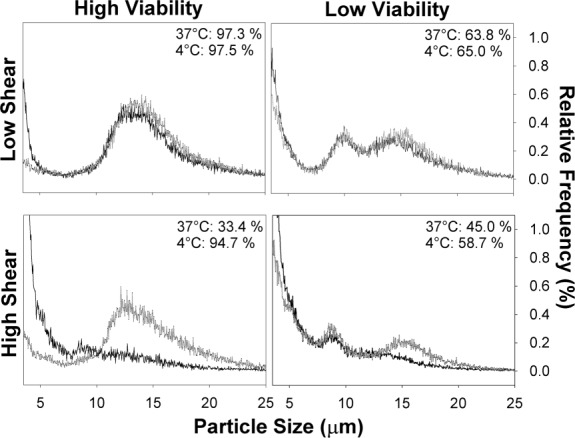
Figure 7. Impact of temperature reduction on particle size distribution following mimic of centrifugal shear forces.

Samples were taken on day 6 (high viability) or 12 (low viability) and were immediately processed ( ) or adjusted to 4°C (
 ) and held for 5 h prior to processing. Samples were sheared at 6,500 or 12,000 rpm, equivalent to maximum energy dissipation rates of 0.06 and 0.53 × 10⁶ W kg−1. The particle sizes were determined using the CASY analyzer, with the data shown in each plot the relative frequency of an average of five replicates. Viability, as determined using the Vi-Cell XR, is also indicated in each plot.
