
Figure 2.
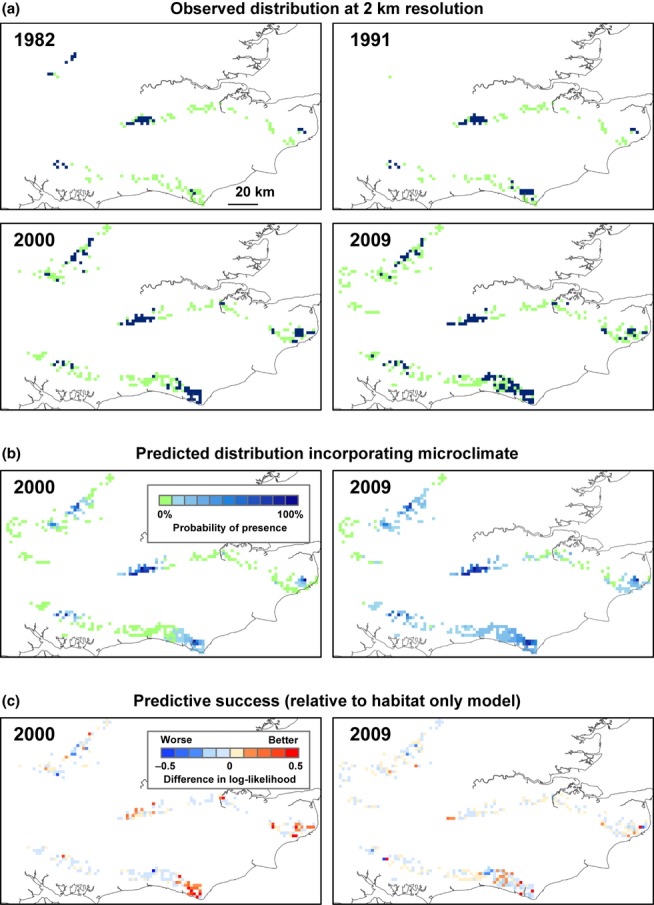
Observed and predicted range expansion of Hesperia comma from 1982 to 2009. The observed distribution maps (a) show 2 km grid cells containing surveyed habitat occupied by H. comma (blue) or vacant (green). Only comprehensively surveyed cells are coloured in each survey date. Predicted distribution maps (b) show the modelled patch network aggregated to 2 km resolution, in each case shaded to represent the proportion of 500 model runs in which each grid square was occupied in the microclimate model. Predictive success (c) is shown relative to the habitat area model, showing the difference in log-likelihood achieved by incorporating microclimate.