Figure 3.
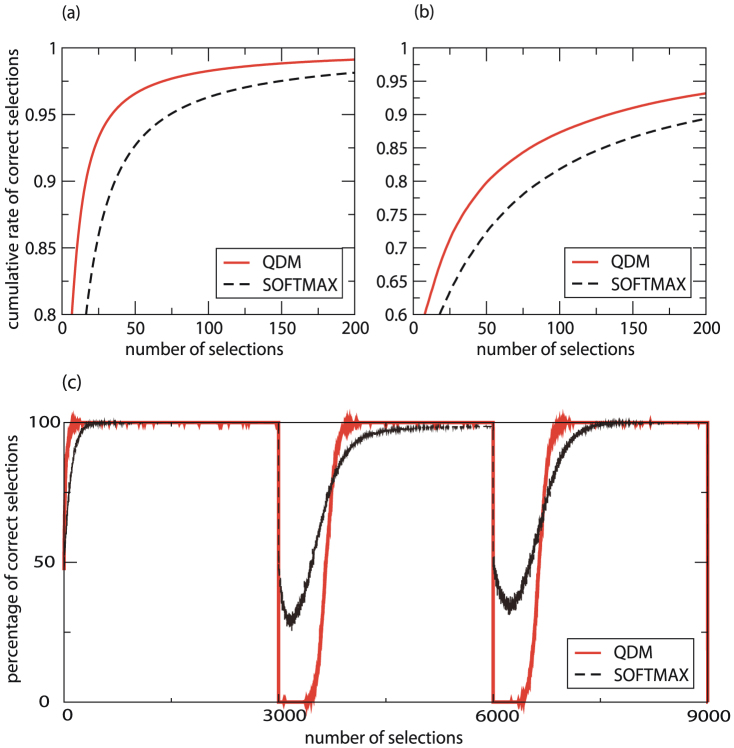
(a) Efficiency comparison 1. The efficiency comparison between the QDM and the softmax rule is for slot machine reward probabilities of PA = 0.2 and PB = 0.8. The cumulative rate of correct selections for the QDM with fixed parameter D = 50 (solid red line) and the softmax rule with optimised parameter τ = 0.40 (dashed line) are shown. (b) Efficiency comparison 2. The efficiency comparison between the QDM and the softmax rule for PA = 0.4 and PB = 0.6. The cumulative rate of correct selections for the QDM with fixed parameter D = 50 (solid red line) and the softmax rule with optimised parameter τ = 0.25 (dashed line) are shown. (c) Adaptability comparison. The adaptability comparison between the QDM and the softmax rule for PA = 0.4 and PB = 0.6. In every 3,000 steps, two reward probabilities switch. The percentage of correct selections for the QDM with fixed parameter D = 50 (red line), and the softmax rule with the optimised parameter τ = 0.08 (black line) are shown. In this simulation, we used the forgetting parameter α = 0.999 (see Methods).

