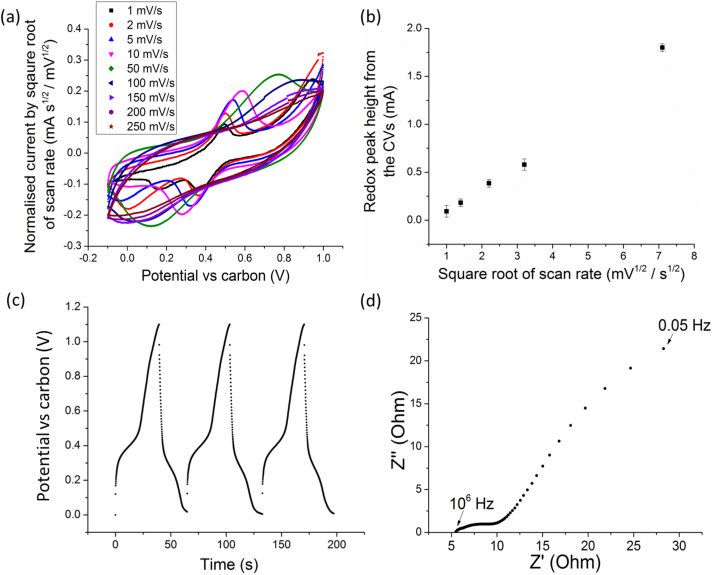
Figure 4.
(a) Cyclic voltammograms of a full cell membrane-based solid-state supercapacitor with MWNT + ionomer electrodes normalised by the square root of the scan rate; (b) a plot of redox peak height from the CVs against square root of scan rate; (c) DC galvanostatic charge/discharge curves of the same solid-state supercapacitor at 1 A g−1; and (d) the complementary Nyquist impedance plot between 106 Hz and 0.05 Hz.

