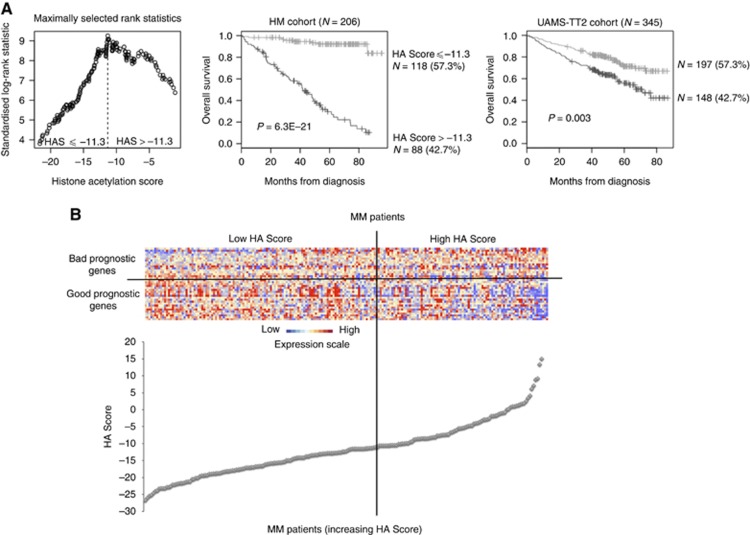
Figure 2.
Prognostic value of HA Score in MM. (A) Patients of the HM cohort were ranked according to increased HA Score and a maximum difference in OS was obtained with HA Score=−11.3 splitting patients into high-risk (42.7%) and low-risk (57.3%) groups. Histone acetylation score also had a prognostic value of an independent cohort of 345 patients from University of Arkansas for Medical Science (UAMS) treated with TT2 therapy (UAMS-TT2 cohort). The parameters to compute the HA Score of patients of UAMS-TT2 cohort and the proportions delineating the two prognostic groups were those defined with HM cohort. (B) Clustergram of HA Score genes ordered from best to worst prognosis. The level of the probe set signal is displayed from low (deep blue) to high (deep red) expression. MM patients (N=206) were ordered by increasing GE-based risk score.

