Fig 3.
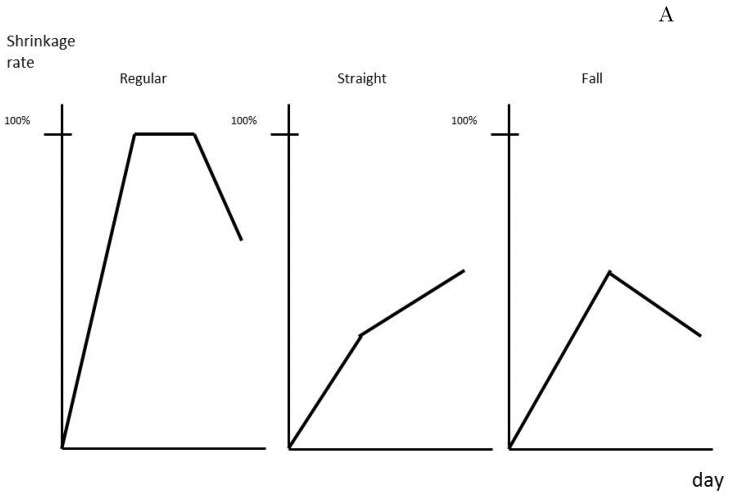
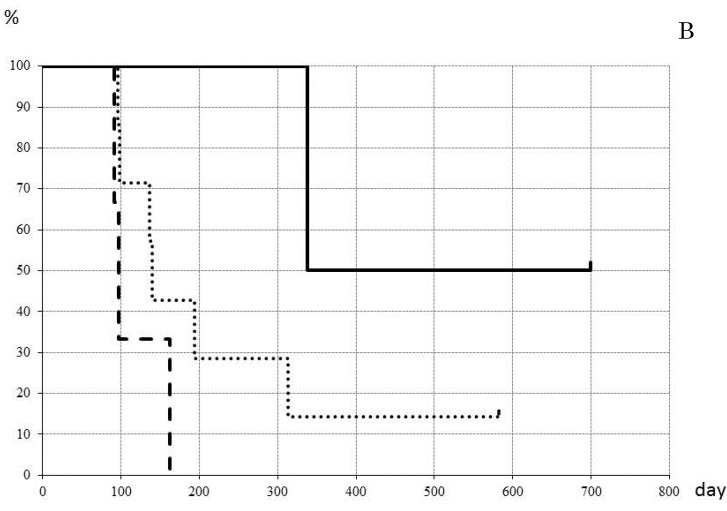
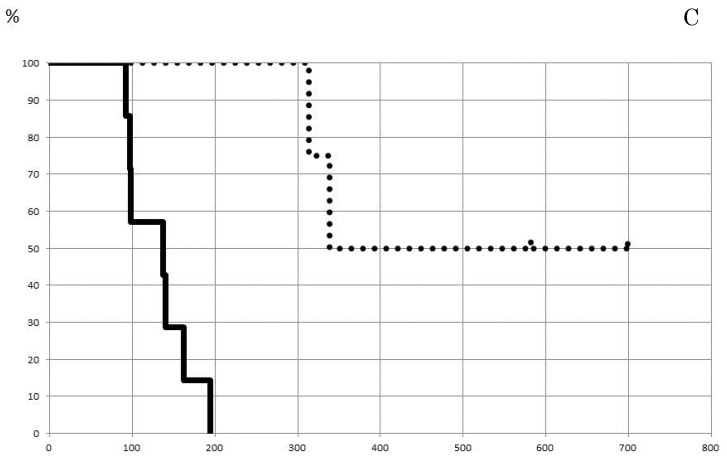
Prediction of patient prognosis. Shrinkage rate was separated into three patterns (A) and the prognosis of each pattern was evaluated (B). The solid line indicates Regular type, the dotted line Straight type, and the dashed line Falling type. (C) Tumor shrinkage rate at the 84th day (12th week) and disease-free survival period are shown. The disease-free survival rate in patients with a shrinkage rate of >0.35% (dotted line) was significantly higher than that in patients with a shrinkage rate of ≤0.35% (p=0.003%).


