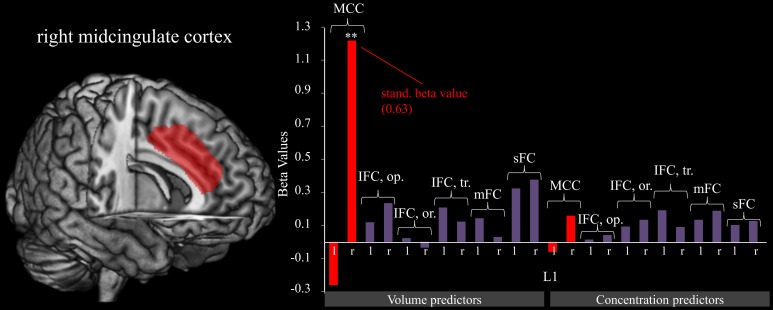
Figure 2.
Right midcingulate cortex predicts L1. The graphic shows the relation of fm-theta increases during training sessions (L1). Predictor variables include gray matter volumes (left) and concentrations (right). The figure reveals that the volume of the MCC contributes strongly to training success as is shown by the significant (**p < 0.001) beta value, whereas all other brain structures show a negligible relationship. For significant predictors, standardized beta values are included as well.

