Figure 2.
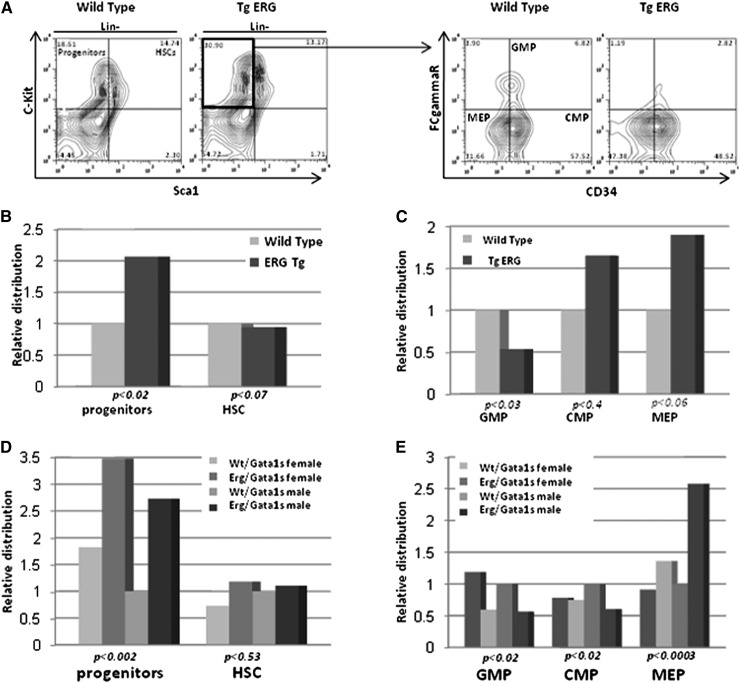
Expansion of MEPs in TgERG embryo FLs is enhanced by Gata1s. (A) Representative flow cytometric analysis showing immunostaining of lineage-negative (Lin−) cells. HSCs are c-Kit+ and Sca1+ and HPCs are c-Kit+ and Sca−. HPCs were subclassified into GMPs (FcγR+ and CD34+), CMPs (FcγR− and CD34+), and MEPs (FcγR− and CD34−), respectively. (B) Relative progenitor and stem cell populations in wild-type and TgERG E14.5 FLs. (C) Distribution of myeloid progenitors in wild-type and TgERG E14.5 FLs. (D) Relative progenitor and stem cell populations in Wt/Gata1s and ERG/Gata1s E14.5 FLs. (E) Distribution of myeloid progenitors in Wt/Gata1s and ERG/Gata1s E14.5 FLs. The bar graphs represent the average of at least 3 independent experiments with n >10 embryos for each genotype. Statistical significant differences (t test for pairs and ANOVA for groups) are detailed in the figure. ANOVA, analysis of variance.

