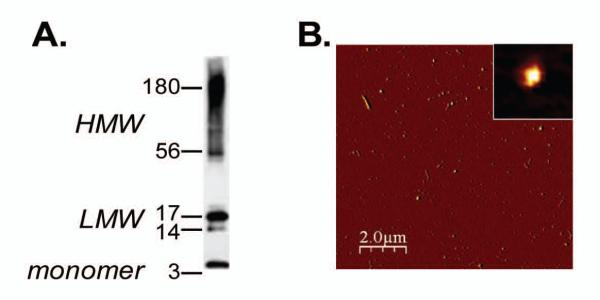
Figure 1. Biophysical characterization of oligomer preparations.

A. 100· M Aβ42-derived oligomers were prepared as described in Material and Method session and subjected to SDSPAGE and western blot using the 6E10 antibody. Monomers, band at 4.5 kDa, low molecular weight species (LMW) ranging from 14-17 kDa, and high molecular weight species (HMW) between 38-180 kDa are visible. B. Atomic force microscopy image of the 100· M stock concentration of oligomers incubated for 24 h at 37°C. Globular structure of oligomers was observed in a 10 × 10 μm x-y scan size. (The scale bar represents 2 μm; the maximum height in the z-axis is 10 nm). The insets represent higher magnification of an oligomer with a diameter of 22 nm and a height of 2.78 nm.
