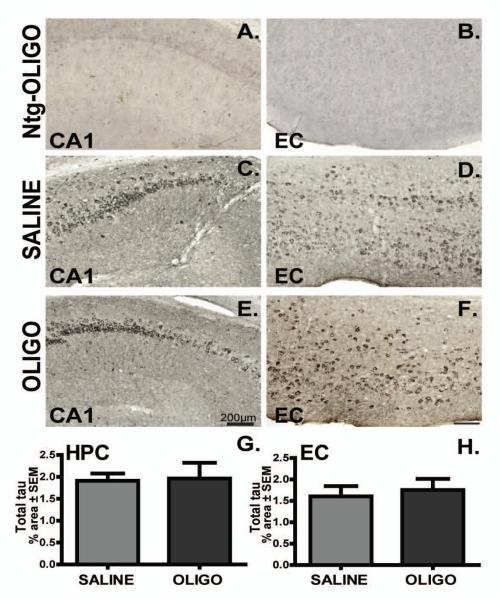
Figure 10. Total tau levels remain unchanged following chronic infusion of oligomer.
Total tau immunoreactivity in CA1 and entorhinal cortex of rTg4510 mice infused with saline (C-D) or OLIGO (E-F) is shown. Endogenous tau was not detectable in nontransgenic (ntg) mice (A-B). Staining density was measured as percent of stained area for each region (G, H), but was unaffected by treatment. Scale bar represents 200μm, Student t-test, n=6.

