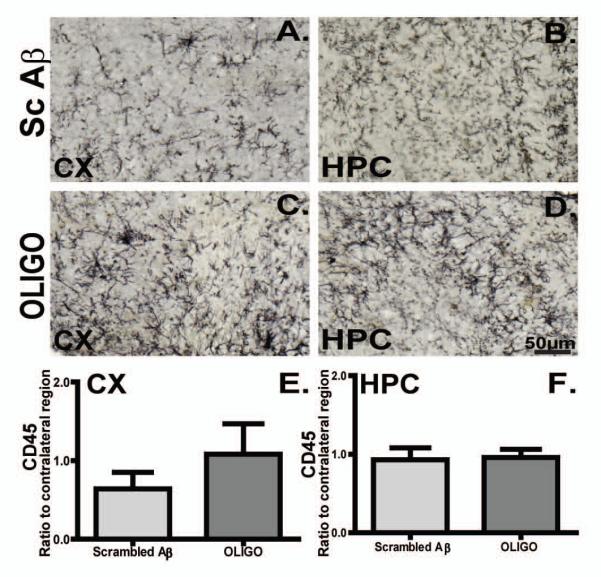
Figure 5. CD45 immunoreactivity was prominent in rTg4510 mouse brain and it did not alter following acute injections of oligomers.

Micrographs represent CD45 immunoreactivity in the frontal cortex (CX) and hippocampus (HPC) of rTg4510 mice following Sc Aβ (A, B, n=5) or OLIGO injections (C, D, n=5). Staining density was analysed as percent of stained area for each region and graphed as ratio of ipsilateral to the contralateral side (E, F). The scale bar represents 50μm.
