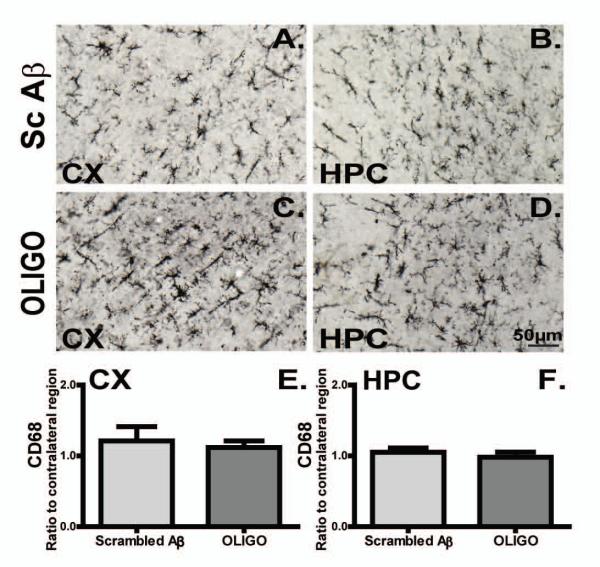
Figure 6. CD68 immunoreactivity present in the transgenic mice did not alter following acute oligomer injections.
Micrographs representing CD68 immunoreactivity in rTg4510 mice regions injected with Sc Aβ (A, B, n=5), or OLIGO (C, D, n=5). Staining density was analysed as percent of stained area for each region and expressed as ratio to the contralateral side (E, F). The scale bar represents 50μm.

