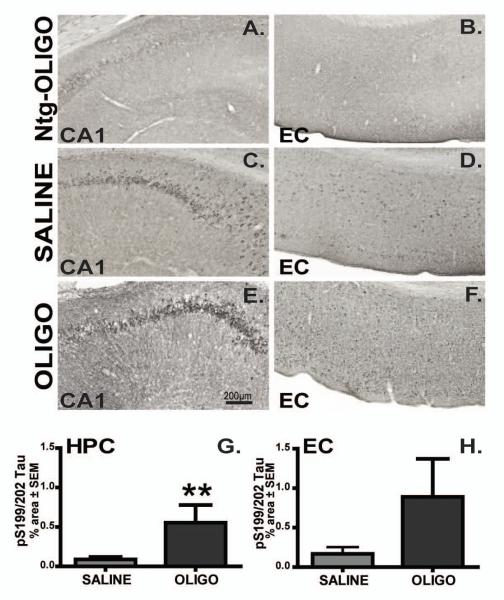
Figure 7. Chronic infusion of oligomers increased immunostaining for pS199/202 tau.
P-S199/202 immunoreactivity in the CA1 region of hippocampus (CA1, depicted images are taken 700 μm from the center of cannula; C, E) or entorhinal cortex (EC, 1600 μm from cannula’s center; D, F) of rTg4510 mice infused with saline (C-D) or OLIGO (E-F) into right hippocampus are shown in all figures from this point unless otherwise stated. Ntg mice infused with OLIGO preparations are used as controls (A-B). Staining density was analysed as percent of stained area for each region (G-H). The scale bar represents 200μm for all panels. Student t-test; ** p< 0.01, n=6.

