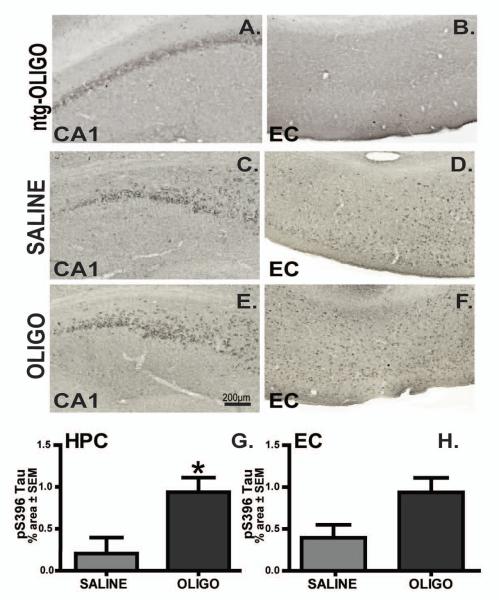
Figure 9. Infusion of oligomers increased pS396 tau levels.
P-S396 immunoreactivity in the CA1 (HPC; A, C, E) and entorhinal cortex (EC; B, D, E) of ntg mice infused with OLIGO (A, B), or rTg4510 mice infusion with saline (C, D) or OLIGO (E, F). Staining density in rTg4510 mice was analysed as percent of stained area for each region (G, H). Scale bar is 200μm. Student t-test; * p< 0.05, n=6.

