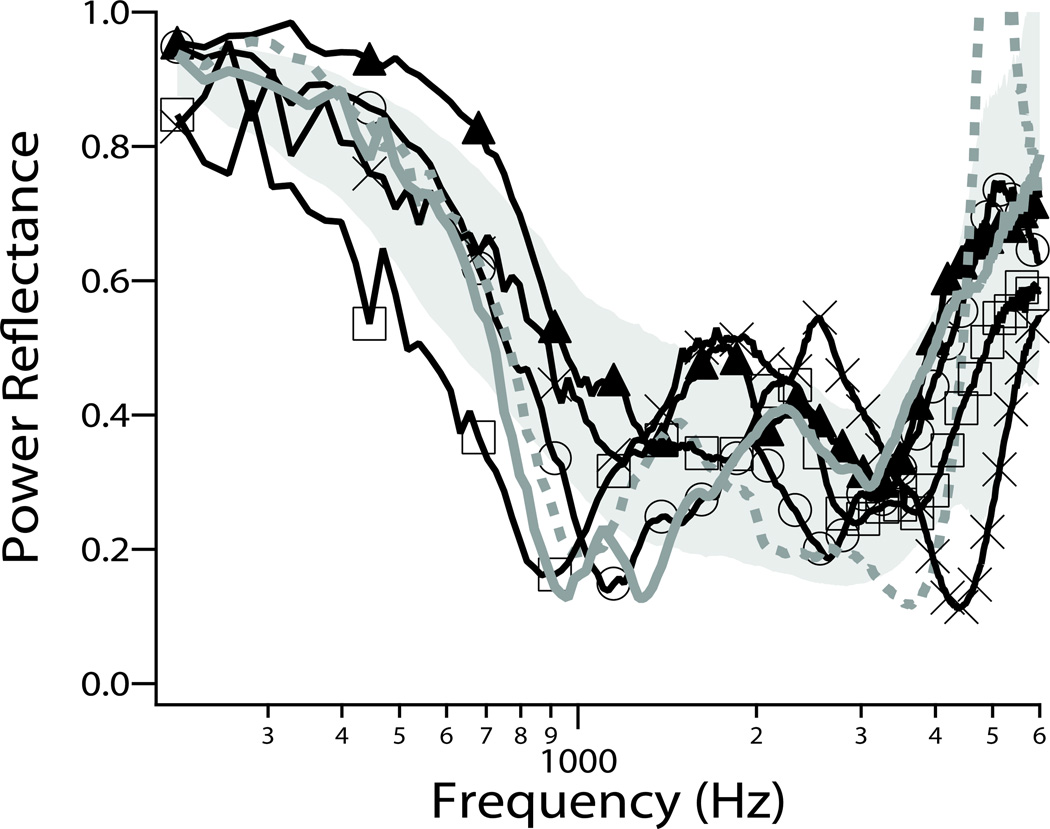
Figure 8.
Examples of PR measurements in six ears with SCD. Four of the ears show notch-like local minima in PR near 1 kHz. The gray area represents ±1 SD around the mean of normal PR. Similar to plot published in Nakajima et al. (2012) (Reprinted with permission from Nakajima, H.H., et al., Ear and Hearing, 33, 35–43. Copyright (2012)).

