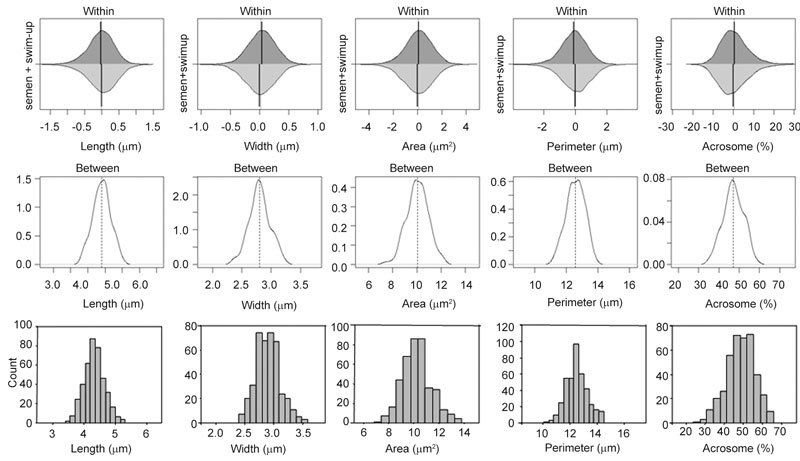
Figure 4.

The upper panel shows within-individual variation from the median value (vertical line) for spermatozoa both in semen (light grey) and swim-up (dark grey) expressed as differences from the median. As no significant differences between sources of spermatozoa were observed, all data were pooled to show the inter-individual variability (middle panel) expressed in absolute measures (length, width and perimeter in microns, area in square microns and acrosome as percentage) on the same scale as that in the other graphs. The lower panel depicts frequency histograms of the morphometric data from spermatozoa selected as being 'normal' in semen or swim-up samples.
