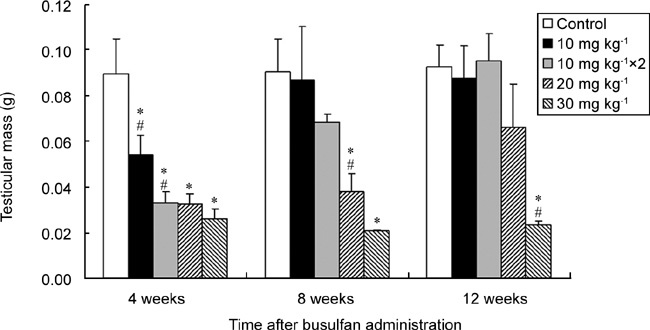
Figure 2.

Changes in testicular mass of BALB/c mice over time after injection of different doses of busulfan. “10 mg kg−1 × 2” represents two injections of 10 mg kg−1 busulfan. *P < 0.05, compared with the control group; #P < 0.05, compared with the previous adjacent dose; n = 6.
