
Figure 5.
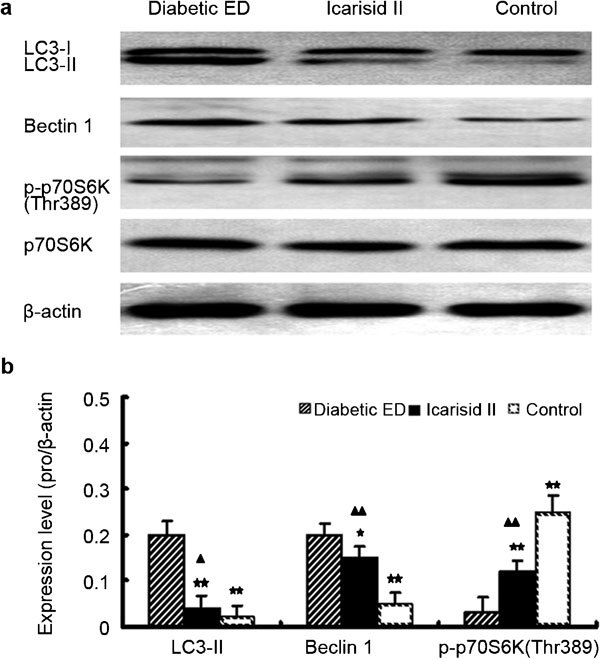
Expression of mTOR signalling pathway proteins in the corpus cavernosum tissue from each group. (a) Western blot of LC3-I/II, Beclin 1, p70S6K, p-p70S6K(Thr389) and β-actin. (b) The relative expression levels were calculated by normalising to β-actin. The differences were then analysed by ANOVA. ★★P<0.01 and ★P<0.05 vs. the diabetic erectile dysfunction (ED) group. ▴▴P<0.01 and ▴P<0.05 vs. the control group.