
Figure 1.
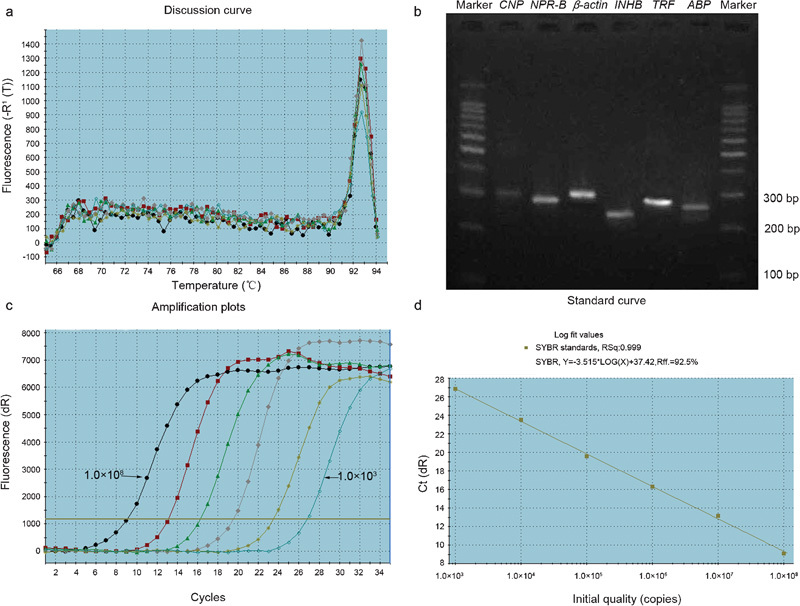
Specific amplification by real-time RT-PCR. (a) A melting curve analysis of a CNP amplification reaction showed a sharp, high peak of the melting temperature (92.8 °C), indicating the presence of a specific product that melts at this temperature; the differentially colored curve corresponds to the same colored curve in (c). (b) Agarose gel electrophoresis analysis demonstrates that this peak corresponds to a single band. (c) A plot of fluorescence from 103 to 108 copies of CNP. (d) A linear standard curve from 103 to 108 copies of CNP. ABP, androgen-binding protein; CNP, C-type natriuretic peptide; INHB, inhibin B; NPR B, natriuretic peptide receptor-B; TRF, transferrin.