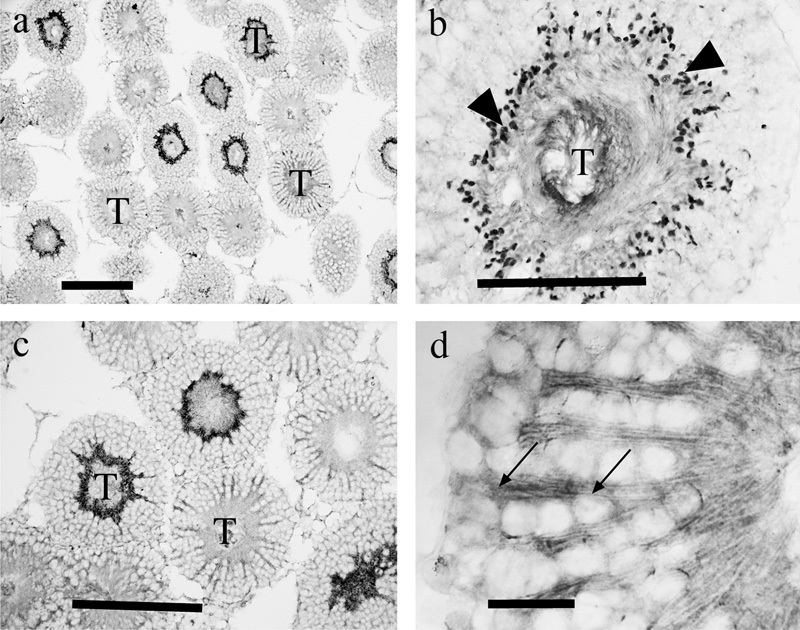
Figure 10.

EAAT5 immunolabeling using a C-terminal directed antiserum (a, b) or one directed against the N-terminal (c, d). The pattern of labeling varied with the maturational state of the sperm in individual tubules (T), the most intense labeling (b) being in puncta (arrowheads), which we interpreted as being the head regions of the sperm, and less intensely (d) in radially oriented structures (probably Sertoli cell processes; arrows). Scale bars: a, c=200 µm; b=100 µm; d=25 µm. EAAT, excitatory amino acid transporter; T, tubules.
