Abstract
This study compared tankyrase 1 expression and autophagy quantity between erectile dysfunction (ED) and non-ED rats' corpus cavernosum smooth muscle cells (CSMCs). This study aslo explored the effect and possible mechanism of tankyrase 1 on autophagy and cell proliferation in ageing ED rats' CSMCs. The intracavernous pressure and mean systemic arterial pressure were measured to investigate erectile function so that eight 24-month-old ED and eight 8-month-old male Wistar rats were choosed respectively. The rat CSMCs were isolated and cultured by enzyme digestion, in which tankyrase 1 expression and autophagy quantity were compared. Tankyrase 1 overexpression was induced with plasmid transfection by Lipofectamine™. The effect of tankyrase 1 overexpression on proliferation, autophagy and mTOR pathway in 24-month-old ED rats' CSMCs was measured by the cell growth curve in MTT assay, cell cycle analysis in flow cytometry (FCM), key protein expression in Western blot, autophagy quantity in transmission electron microscopy, monodansylcadaverine staining and GFP-LC3 fluorescence. The primary CSMCs were confirmed by immunofluorescence, and the purity was 99.1% in FCM. Compared with that of 8-month-old rats, tankyrase 1 expression and autophagy quantity significantly decreased in 24-month-old ED rats' primary CSMCs (P < 0.01). Tankyrase 1 overexpression significantly increased the growth rate (P < 0.05) and increased the S phase of cell cycle (P < 0.01). The autophagosome quantity was remarkably increased (P < 0.01), LC3-I/II and Beclin 1 were upregulated (P < 0.01 and P < 0.05), and p-p70S6K (Thr389) was downregulated in 24-month-old ED rat CSMCs (P < 0.05). In conclusion, Tankyrase 1 and autophagy decrease in the CSMCs from aging rats with ED, and tankyrase 1 may have a positive effect on proliferation by enhancing autophagy and regulating the mTOR signalling pathway.
Keywords: ageing, autophagy, corpora cavernosum, corpus cavernosum smooth muscle cells, erectile dysfunction, senile, tankyrase
Introduction
Recent studies on erectile dysfunction (ED) show that the relaxation of the corpus cavernosum smooth muscle cells (CSMCs) is the key factor for penile erection and that the NO-cGMP signalling pathway plays an important role in penile erection 1. cGMP is hydrolysed by phosphodiesterase type 5 (PDE5), and it improves erectile function by either increasing the formation of NO by activating NOS or decreasing the degradation of cGMP by inhibiting the activity of PDE5 in the cavernosum 2.
Sildenafil, a specific PDE5 inhibitor, is a safe and effective drug for treating ED on demand; however, it shows a poor effect on age-related organic ED, especially on restoring the pathological changes of ED 3. With the increased number of ageing males in the population, the number of senile ED patients is increasing steadily. Ageing is commonly considered a high-risk factor of ED, which seriously affects the quality of life in senile men 4.
At present, the mechanism of age-related ED is not well known. Our studies and other studies found that the ratio of CSMCs and collagen fibres significantly decreased in the erectile tissue of age-related ED patients 5, 6. It is well known that the renin–angiotensin system plays an important role in causing fibrosis of smooth muscle cells during ageing, and angiotensin II type 1 receptor blockers and angiotensin-converting enzyme inhibitors can ameliorate the fibrosis of smooth muscle cells and extend the life span in animal models 7, 8, 9, 10. Until now, no ideal method has been found to completely reverse such pathological changes in the clinical setting 11.
With ageing, the activity of autophagy-related enzymes and morphology of lysosomes change in nearly all tissues. For example, two autophagies in cells (giant autophagy and incidental autophagy) significantly decrease in ageing males 12. Recently, the relevance of autophagy and longevity was found in nematodes, providing corresponding genetic evidence for the relationship between autophagy and longevity 13. Age-related changes of autophagosomes were also observed in many cells, including myocardial cells, skeletal muscle fibres and other long-lived cells 14. Other studies also reported that cell autophagic activity decreased with ageing, which may be related to age-related diseases such as ED 15. The signal transduction molecules involved in the process of autophagy are very complex; the mTOR signalling pathway is currently widely studied 16, 17, 18. Tankyrase 1 is closely related to autophagy and modifies multiple proteins involved in the maintenance of telomere length and sister telomere association 19, 20. To our knowledge, there is no report about its effect on ED. Previously, we found that tankyrase 1 overexpression could extend the life span of rat CSMCs 15. We also found that the CSMC content, erectile function, tankyrase 1, and autophagy in 24-month-old rats' corpus cavernosum tissue was less than those in 8-month-old rats' corpus cavernosum tissue 6.
Then, we speculated that senile ED or delayed sexual dysfunction may be closely related to proliferation, tankyrase 1 and autophagy in CSMCs. To further explore the possible mechanism of senile ED, tankyrase 1 expression and autophagy in ED and non-ED rats' CSMCs were compared, and the effect of tankyrase 1 overexpression on cell proliferation and autophagy in ageing rats' CSMCs was investigated.
Materials and methods
Intracavernous pressure/mean systematic arterial pressure (ICP/MAP) measurement 21
After rats were anaesthetized with intraperitoneal sodium pentobarbital (50 mg kg−1), the rat cavernous nerve (CN) was identified for electrostimulation (3 V, 12 Hz and duration 60 s), the rat left cavernosum and left carotid artery were separated and exposed, and 26-G teleflex needles were pierced and then connected with a Biopac multi-purpose polygraph (Biopac, Santa Barbara, CA, USA) to monitor ICP and MAP separately. In order to rule out the influence of cavernosum intra-arterial pressure on the evaluation of erectile function, ICP/MAP was used to evaluate the erectile function induced by CN stimulation comprehensively.
Rat CSMC culture, identification and purity analysis
Male Wistar rats (Grade A, certificate No. scxk11-00-0006) were obtained from the Animal Breeding Center of Peking University Health Science Center (Beijing, China). The CSMCs were isolated from 8-month-old non-ED and 24-month-old ED rats selected by ICP/MAP measurement. The cells were cultured in Dulbecco's modified Eagle's medium supplemented with 10% fetal calf serum, 100 U mL−1 penicillin and 100 mg mL−1 streptomycin (Invitrogen, Carlsbad, CA, USA) using the enzyme digestion method. The cultured and purified CSMCs were kept in a humidified atmosphere of 5% CO2 at 37°C. The primary rat CSMCs were used in the corresponding experiments. The CSMCs were further confirmed with an FITC-α-SM-actin antibody (Santa Cruz Biotechnology, Santa Cruz, CA, USA) by immunofluorescence. Rat fibroblasts labelled with FITC-anti-α-SM-actin were used as negative control. The purity of the CSMCs was analysed by measuring the α-SM-actin positive ratio in flow cytometry (FCM).
Autophagosome observation in transmission electron microscopy (TEM)
Specimens were fixed with ice-cold glutaraldehyde (3% in 0.1 mol L−1 cacodylate buffer, pH 7.4) for 30 min. The cultured cells were post-fixed in osmium tetroxide (OsO4) and embedded in Epon; 0.1-mm-thin sections were stained with uranyl acetate/lead citrate (Sigma-Aldrich, St. Louis, MO, USA) and viewed in a JEM1230 TEM (JEOL, Tokyo, Japan).
CSMCs with tankyrase 1 transfection, rapamycin and 3-methyladenine treatment
All transfections were carried out with Lipofectamine™ 2000 (Invitrogen) according to the manufacturer's instructions. The CSMCs were seeded in 25 cm2 culture flasks (Renner, Darmstadt, Germany), incubated overnight in complete growth medium and then treated with 8 μg of corresponding plasmid transfection, 5 nmol L−1 rapamycin or 5 mmol L−1 3-methyladenine (3-MA). After 48 h of incubation, the CSMCs were used in the corresponding experiments.
Cell growth curve and cell cycle analysis after tankyrase 1 transfection
The proliferation ability was investigated using a cell growth curve drawn by the MTT method and cell cycle analysis in FCM. The optical density (OD) value was measured at 570 and 630 nm with a microplate reader (Bio-Rad, Hercules,CA, USA). The growth curve was made according to OD value. Cell cycle analysis was evaluated with a flow cytometer (FACS; Becton Dickinson, Franklin Lakes, NJ, USA). For each sample, 2 × 10⁵ cells were measured.
Labelling autophagosomes with monodan-sylcadaverine (MDC) staining or GFP-LC3 transfection
After incubation with 0.05 mmol L−1 MDC (Sigma-Aldrich) in the culture medium at 37°C for 1 h, the CSMCs on cover slips were washed with phosphate-buffered saline (PBS), fixed with 4% paraformaldehyde, and observed with an SP5 confocal system (Leica, Solms, German) with excitation and emission filters of 380 and 525 nm wavelength, respectively. The CSMCs were transfected with GFP-LC3 plasmid by using Lipofectamine™ 2000 reagent and observed for LC3-I/II distribution with the SP5 confocal system. Five non-overlapping fields in each group were randomly selected, and 10 cells in each field were randomly selected for MDC or GFP-LC3 punctuate distribution analysis. Statistical data were obtained from three independent experiments.
Tankyrase 1 and mTOR pathway key component detection via western blot
The homogenized samples were prepared in a lysis buffer containing 1% IGEPAL CA-630, 0.5% sodium deoxycholate, 0.1% SDS, 10 μg mL−1 aprotinin, 10 μg mL−1 leupeptin, and PBS. Cell lysates (50 μg protein) were electrophoresed in SDS-PAGE and then transferred to a polyvinylidene fluoride membrane (Millipore Corp., Bedford, MA, USA). The membrane was stained with Ponceau S to verify the integrity of the transferred proteins and to monitor the unbiased transfer of all protein samples. Detection of target proteins on the membranes was performed with an electrochemiluminescence kit (Amersham Life Sciences Inc., Arlington Heights, IL, USA) with 1:1 000 primary antibodies for tankyrase LC3-I/II, Beclin 1, p70S6K, p-p70S6K(Thr389) and β-actin (all antibodies were from Santa Cruz Biotechnology). After the hybridization of secondary antibodies, the resulting images were analyzed with a BioRad GS-670 densitometer (Bio-Rad) and UTHSCSA Image Tool for Windows (3.0) (University of Texas Medical School at San Antonio, San Antonio, TX, USA) to determine the integrated density value of each protein band.
Statistical analysis
All experiments were repeated three times, eight different specimens each time. Data are expressed as mean ± SD and were analysed by the SPSS 13.0 software package (SPSS Inc., Chicago, IL, USA). Statistical difference analysis was carried out by one-way ANOVA, unpaired t-test, Student–Newman–Keuls analysis and Mann–Whitney U test. P < 0.05 was considered statistically significant.
Results
ICP/MAP measurement
Twenty-four-month-old ED rats were selected with an ICP/MAP measurement of < 0.45, and 8-month-old non-ED rats were selected with an ICP/MAP measurement of > 0.70. Compared with that of 8-month-old rats (0.76 ± 0.09), ICP/MAP decreased to 0.45 ± 0.07 in 24-month-old ED rats (P < 0.01).
CSMC culture, identification and purity analysis
The CSMCs of 8-month-old non-ED rats and 24-month-old ED rats grew well in vitro and were identified with an α-SM-actin-positive result by immunofluorescence. The rat fibroblasts labelled with FITC-anti-α-SM-actin were used as a negative control and had almost no observable fluorescence. The CSMC purity was 99.2% ± 13.7% with an α-SM-actin positive rate as measured by FCM (Figure 1).
Figure 1.
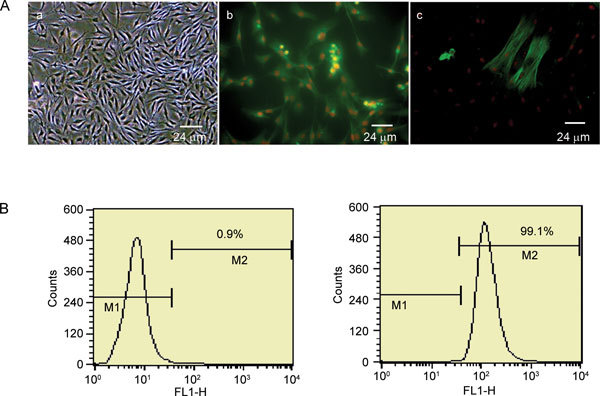
Rat corpus cavernosum smooth muscle cells (CSMCs) identification and purity analysis. CSMCs were identified by phase contrast microscopy and immunofluorescence (multiple × 800) (A). Typical peak-valley-like growth was observed by phase contrast microscopy (a). CSMCs labelled with FITC-anti-α-SM-actin were observed with fluorescence under an immunofluorescence microscope (b). Rat fibroblasts labelled with FITC-anti-α-SM-actin were observed with almost no fluorescence and used as a negative control (c). CSMC purity was analyzed with FITC-anti-α-SM-actin antibody by flow cytometry (B). M1 indicated the ratio of cell debris or cells not labelled with FITC-anti-α-SM-actin, and M2 were presented as the relative ratio of cells labelled with FITC-anti-α-SM-actin.
Tankyrase 1 and autophagosomes decreased in rat CSMCs
Compared with those of the primary cultured 8-month-old rats' CSMCs, the expression of tankyrase 1 and the number of autophagosomes decreased in primary cultured 24-month-old ED rats' CSMCs (P < 0.01) (Figures 2 and 3).
Figure 2.
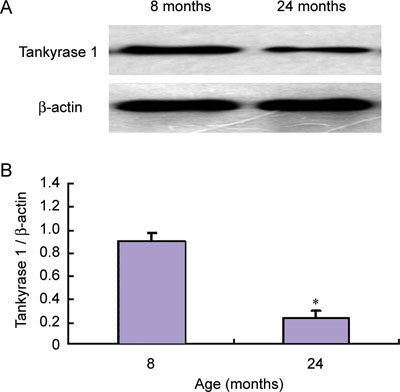
Expression of tankyrase 1 in CSMCs from 8-month-old non-ED (erectile dysfunction) and 24-month-old ED rats. CSMCs were isolated and cultured primarily in complete medium using the enzyme digestion method. After the CSMCs adhered to the wall of the dishes and cell density reached 90% confluence, the CSMCs were used for protein isolation and subsequently used for Western blot analysis with anti-tankyrase 1 antibody. The relative expression was calculated by normalizing to β-actin. The expression of tankyrase 1 in 24-month-old ED rats' CSMCs was obviously less than that of 8-month-old rats' CSMCs (A). The relative expression was calculated by normalizing to β-actin (B). *P < 0.01, compared with CSMCs of 8-month-old rats.
Figure 3.
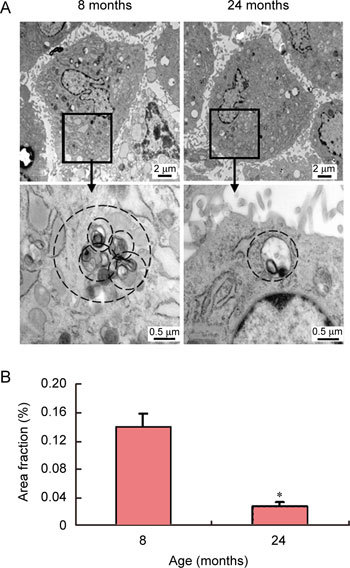
Morphological analysis of autophagy in the CSMCs of rats of different ages using transmission electron microscopy (TEM) (up multiple × 10 000, down multiple × 50 000). Autophagosome loss was observed in 24-month-old ED rats' CSMCs (A). The morphometric analysis of the area fraction (autophagosomes/cytoplasm) was calculated by Leica QWin Pro V2.6 image analysis and processing software (B). The data of the area ratio were not distributed normally. Data are presented as the mean of the area fraction in 50 cells randomly selected in each group. The difference was then analyzed by the Mann–Whitney U test. *P < 0.01, compared with CSMCs of 8-month-old rats.
Tankyrase 1 expression increased in the ageing rats' CSMCs with plasmid transfection
Highly purified CSMCs from 24-month-old ED rats were obtained and transfected with tankyrase 1 plasmid by the Lipofection™ 2000 method. The expression of tankyrase 1 in the CSMCs with tankyrase 1 transfection obviously increased compared with that of the non-transfected control (P < 0.05) (Figure 4).
Figure 4.
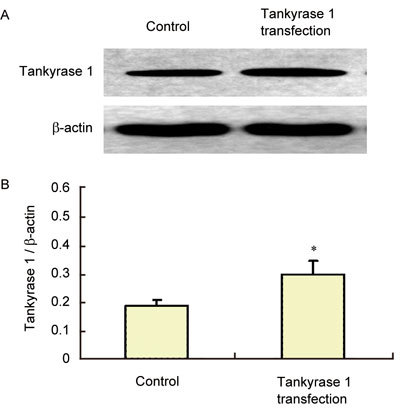
Transfection efficiency of tankyrase 1 plasmid. The 24-month-old ED rats' CSMCs were cultured. Tankyrase 1 was transfected using the Lipofection™ 2000 method. After 48 h, the cells were lysed with RIPA buffer (1:100 proteinase inhibitors). Western blot was done with an anti-tankyrase 1 antibody. The expression of tankyrase 1 significantly increased after tankyrase 1 transfection (A). The relative expression was calculated by normalizing to β-actin (B). *P < 0.05, compared with 24-month-old ED rats' CSMCs without tankyrase 1 transfection (Control).
Cell multiplication increased in the ageing rats' CSMCs with tankyrase 1 transfection
Compared with the non-transfected control, the CSMCs grew faster and the OD value was greater in 24-month-old ED rats' CSMCs with tankyrase 1 transfection, especially at days 5, 6 and 7 (P < 0.05) (Figure 5A). Further study on the cell cycle analysis showed that the S phase (DNA synthesis period) increased to nearly two times that of the non-transfected control (P < 0.01) (Figure 5B).
Figure 5.
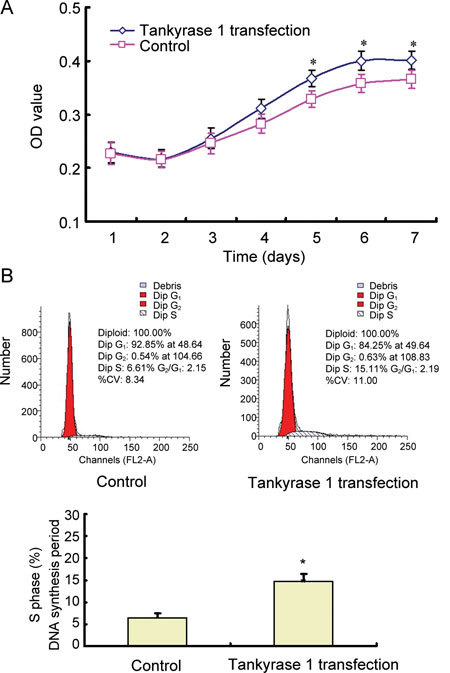
The cell growth curve and cell cycle analysis in the ageing rats' CSMCs with or without tankyrase 1 transfection. The 24-month-old ED rats' CSMCs were cultured and transfected with tankyrase 1 plasmid. The CSMCs with tankyrase 1 transfection grew faster than non-transfected control. The cell growth curve was assayed with the OD value by the MTT method (A). On days 5, 6 and 7, the OD value in transfected cells obviously increased more than that of a non-transfected control. *P < 0.05, compared with 24-month-old ED rats' CSMCs without tankyrase 1 transfection (Control). The cell cycle analysis was performed on day 2 after transfection. S phase cells of the transfected cells increased to nearly two times that of non-transfected controls (B). *P < 0.05, compared with the 24-month-old ED rats' CSMCs without tankyrase 1 transfection (control).
Autophagosome number increased in the ageing rats' CSMCs with tankyrase 1 transfection
Compared with the non-transfected control, the quantity of autophagosomes significantly increased in 24-month-old rats' CSMCs with tankyrase 1 transfection and rapamycin treatment (P < 0.01). On the other hand, few autophagosomes were observed in rat CSMCs with 3-MA treatment (P > 0.05). Similar results came from TEM, MDC staining and GFP-LC3 transfection (Figure 6).
Figure 6.
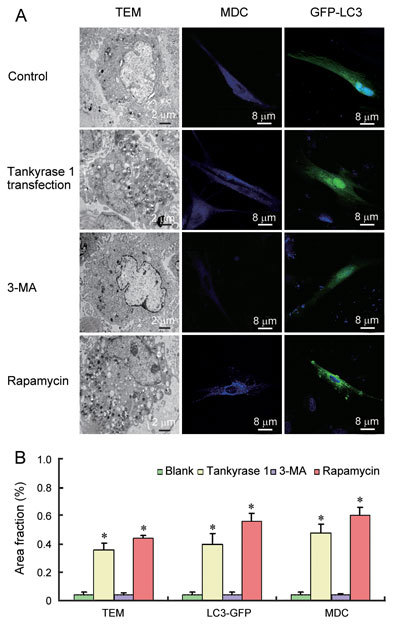
Morphological analysis of autophagy in ageing ED rats' CSMCs with or without tankyrase 1 transfection. Rapamycin and 3-methyladenine (3-MA) treatment were used as positive and negative controls, respectively. Overexpression of tankyrase 1 enhanced autophagy, as evidenced by increased autophagosome quantity in TEM (multiple × 10 000), monodansylcadaverine (MDC) staining (multiple × 800) and GFP-LC3 transfection method (multiple × 800) (A). The morphometric analysis of the area fraction (autophagosomes/cytoplasm) was calculated by Leica QWin Pro V2.6 image analysis and processing software (B). The data of the area ratio were not distributed normally. Data were presented as the mean of the area fraction (autophagosomes/cytoplasm) in the 50 cells (randomly selected) in each group. The difference was then analysed by the Mann–Whitney U test. *P < 0.01, compared with the 24-month-old ED rats' CSMCs without tankyrase 1 transfection (Blank).
The mTOR pathway was enhanced in ageing rats' CSMCs with tankyrase 1 transfection
Compared with the non-transfected control, the expressions of LC3 I/II and Beclin 1 significantly increased (P < 0.01 and P < 0.05, respectively), the expression of p70S6K was not obviously affected, and the expression of p-p70S6K(Thr389) significantly decreased in 24-month-old ED rats' CSMCs with tankyrase 1 transfection and rapamycin treatment (P < 0.05). Compared with the non-transfected control, the above index exhibited no obvious difference in 24-month-old ED rats' CSMCs with 3-MA treatment (P > 0.05) (Figure 7).
Figure 7.
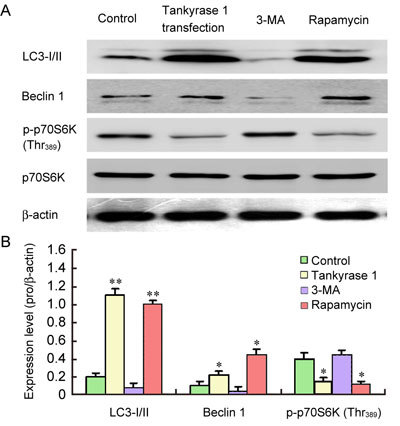
Protein assay of mTOR signalling pathway in ageing rats' CSMCs with or without tankyrase 1 transfection. Rapamycin and 3-MA were used as positive and negative controls, respectively. No significant difference was observed in the expression of p70S6K. The expression of LC3-I/II and Beclin 1 increased, while the expression of p-p70S6K(Thr389) decreased in the CSMCs with tankyrase 1 transfection compared with non-transfected control (A). The relative expression was calculated by normalizing to β-actin (B). *P < 0.05, **P < 0.01, compared with the 24-month-old ED rats' CSMCs without tankyrase 1 transfection (Control).
Discussion
The loss of tankyrase 1, autophagy, CSMC content and erectile function is closely related to ageing
In 1992, the NIH Consensus Conference determined that ageing is an indirect risk factor closely related to ED, which might increase the pathogenic possibility caused by direct risk factors 17. Telomere shortening is a molecular clock symbolizing the start of ageing, and telomerase can catalyse and copy the telomeres to prolong cell life 18. It was reported that the second ageing-related cell enzyme, tankyrase, may positively regulate telomerase activity and may play a regulatory role in intracytoplasmic signalling pathways 19, 20.
Our previous studies found that ageing had a significant impact on rat ED, penile tissue structure, telomerase and tankyrase 1 and that tankyrase 1 extended rat CSMC telomere length and life 6, 15. We also found that the telomerase activity of rat CSMCs was highest in young rats' CSMCs and lowest in those of ageing rats, gradually decreasing with ageing 15. In our results, we observed that tankyrase 1 also gradually decreased with ageing. These results coincide with that of other studies indicating that changes in tankyrase 1 follow the direction of telomerase 21, 23.
Most scholars divide cell death into three types: programmed cell death (Apoptosis PCD), autophagic programmed cell death (Autophagic PCD) and necrosis (Necrosis) 13. The phenomenon of autophagy was first observed with autophagosomes in cells by electron microscopy in 1962, and transmission electron microscopy is considered the diagnostic gold standard of autophagy 24. The ultrastructure of the autophagy lysosomes and autophagosomes and biochemical and fluorescent methods are normally used for autophagy diagnosis 16. This study also found that the amount of autophagosomes was significantly decreased in ageing rats' CSMCs and that tankyrase 1 and autophagy were closely related to ageing.
Tankyrase 1 might enhance autophagy by regulating the mTOR signalling pathway to enhance multiplication
After transfection with tankyrase 1, tankyrase 1 expression was increased in ageing ED rat CSMCs. At the same time, we observed that the number of autophagosomes increased after tankyrase 1 overexpression. These phenomena were further confirmed by TEM, MDC staining, GFP-LC3 transfection and LC3 protein measurement via Western blot. These observations suggested that tankyrase 1 can affect autophagy and the production of autophagosomes. LC3 is a homologue of the ATG8 (Aut7/Apg8) gene in mammalian cells located in the membrane surface of the preautophagic vacuole and autophagic vacuole and is a common membrane marker of the autophagic vacuole. The newly synthesised LC3 in cells becomes soluble cytoplasmic LC3-I, which is processed by ubiquitin-like modification and then combined with phosphatidylethanolamine on the membrane surface, forming LC3-II. LC3-II content is in direct proportion to the number of autophagic vacuoles, reflecting the autophagy activity to some extent 25. In our western blot results, LC3-II was more sensitive than LC3-I. LC3 and the conversion of LC3-I to LC3-II increase when autophagy in mammalian cells occurs 16. As a result, the autophagy increase might have come from the tankyrase 1 transfection.
The signal transduction molecules involved in autophagy are complex, and the mTOR signalling pathway is currently widely studied 17. TOR kinase is the receptor of amino acids, ATP and hormones and may play an important role in the regulation of cell growth 26. It is a negative control element of autophagy 27. We found that cells grow faster and that the DNA synthesis period was prolonged in tankyrase 1-transfected cells, which may be due to the enhanced autophagy through increasing Beclin 1 and decreasing p-p70S6K in the mTOR signalling pathway.
Beclin 1, a necessary protein for the occurrence of autophagy, is a homologue of yeast Apg6/Vps30 gene in mammals. The two-hybrid screening test has proved that Beclin 1 is an interactive protein of Bcl-2 and that Beclin 1 is the regulatory gene of autophagy 28. Beclin 1 is located on human chromosome 77q21, about 150 kb, and it is involved in the formation of autophagosomes by forming a complex with Class III PI3K 29, 30. Aita et al. 31 reported that Beclin 1 not only participated in the formation of autophagosomes, but also played an important role in the growth of cells by regulating autophagy activity. Yue et al. 32 also found that autophagy activity was lower in the cells of a Beclin 1 knockout mouse. These results suggest that Beclin 1 is critical for autophagy activity 33. Our results showed that tankyrase 1 transfection increased the activity of the mTOR signalling pathway by Beclin 1 up-regulation.
p70S6k is the ribosomal 40S small subunit S6 protein kinase, which regulates 5′-TOP mRNA translation through the phosphorylation of protein S6. Studies show that all ribosomal proteins and transcription fragments of translation extension factors contain 5′-TOP structure in their translation starting point, so p70S6k controls the biological synthesis of translation components, which is necessary for protein synthesis 34. S6K has been determined as one of the downstream substrates of the mTOR pathway, and it has a critical role in cell growth. As a single kinase of the mTOR substrate, S6K can affect the translation of hundreds of mRNAs and can adjust biosynthesis through regulation of ribosomal protein S6. It is reported that S6K plays a decisive role in the growth of the cytoskeleton 35. Our results showed that cells grew faster after tankyrase 1 transfection in ageing rats' CSMCs, which may be because tankyrase 1 increased the activity of the mTOR signalling pathway by decreasing phosphorylation of p70S6K 18, 35.
In this study, we observed that tankyrase 1 and autophagy decreased in ageing ED rats' CSMCs, which coincided with the CSMC loss in age-related organic ED. We also found that proliferation, autophagy and the mTOR signalling pathway were enhanced in ageing rats' CSMCs with tankyrase 1 overexpression. Although we did not discern a direct relationship among tankyrase 1, autophagy and smooth muscle cell proliferation, the enhanced mTOR pathway may provide us one possible mechanism. Further study is needed.
Disclosure statement
The authors have no conflicting interests to disclose.
Acknowledgments
We are grateful to Dr Tamotsu Yoshimori for providing the GFP-LC3 plasmid and Dr H. Seimiya for providing the tankyrase 1 plasmid. This study was supported by the National Natural Science Foundation of China (No. 30772285) and Beijing Municipal Commission of Science Technology, China (No. Z080507030808011).
References
- Rashid A. The efficacy and safety of PDE5 inhibitors. Clin Cornerstone. 2005;7:47–56. doi: 10.1016/s1098-3597(05)80048-1. [DOI] [PubMed] [Google Scholar]
- Montorsi F, Briganti A, Salonia A, Rigatti P, Burnett AL. Can phosphodiesterase type 5 inhibitors cure erectile dysfunction. Eur Urol. 2006;49:979–86. doi: 10.1016/j.eururo.2005.12.055. [DOI] [PubMed] [Google Scholar]
- Montorsi F, McCullough A. Efficacy of sildenafil citrate in men with erectile dysfunction following radical prostatectomy: a systematic review of clinical data. J Sex Med. 2005;2:658–67. doi: 10.1111/j.1743-6109.2005.00117.x. [DOI] [PubMed] [Google Scholar]
- Camacho ME, Reyes-Ortiz CA. Sexual dysfunction in the elderly: age or disease. Int J Impot Res. 2005;17(Suppl 1):S52–6. doi: 10.1038/sj.ijir.3901429. [DOI] [PubMed] [Google Scholar]
- Costa WS, Carrerete FB, Horta WG, Sampaio FJ. Comparative analysis of the penis corpora cavernosa in controls and patients with erectile dysfunction. BJU Int. 2006;97:567–9. doi: 10.1111/j.1464-410X.2005.05917.x. [DOI] [PubMed] [Google Scholar]
- Zhang J, Wu XJ, Yuan YM, Liu Bao X, Cui WS, et al. Relationship of Tankyrase 1 and autophagy on erectile dysfunction in aging rats. Chin J Androl. 2010;24:7–11. [Google Scholar]
- Zhu YC, Zhu YZ, Gohlke P, Stauss HM, Unger T. Effects of angiotensin-converting enzyme inhibition and angiotensin II AT1 receptor antagonism on cardiac parameters in left ventricular hypertrophy. Am J Cardiol. 1997;80:110A–17A. doi: 10.1016/s0002-9149(97)00465-7. [DOI] [PubMed] [Google Scholar]
- Kuno A, Yamada T, Masuda K, Ogawa K, Sogawa M, et al. Angiotensin-converting enzyme inhibitor attenuates pancreatic inflammation and fibrosis in male Wistar Bonn/Kobori rats. Gastroenterology. 2003;124:1010–9. doi: 10.1053/gast.2003.50147. [DOI] [PubMed] [Google Scholar]
- Yamada T, Kuno A, Ogawa K, Tang M, Masuda K, et al. Combination therapy with an angiotensin-converting enzyme inhibitor and an angiotensin II receptor blocker synergistically suppresses chronic pancreatitis in rats. J Pharmacol Exp Ther. 2005;313:36–45. doi: 10.1124/jpet.104.077883. [DOI] [PubMed] [Google Scholar]
- Miyazaki R, Ichiki T, Hashimoto T, Inanaga K, Imayama I, et al. SIRT1, a longevity gene, downregulates angiotensin II type 1 receptor expression in vascular smooth muscle cells. Arterioscler Thromb Vasc Biol. 2008;28:1263–9. doi: 10.1161/ATVBAHA.108.166991. [DOI] [PubMed] [Google Scholar]
- Campaner AB, Ferreira LM, Gragnani A, Bruder JM, Cusick JL, et al. Upregulation of TGF-beta1 expression may be necessary but is not sufficient for excessive scarring. J Invest Dermatol. 2006;126:1168–76. doi: 10.1038/sj.jid.5700200. [DOI] [PubMed] [Google Scholar]
- Park YE, Hayashi YK, Bonne G, Arimura T, Noguchi S, et al. Autophagic degradation of nuclear components in mammalian cells. Autophagy. 2009;5:795–804. doi: 10.4161/auto.8901. [DOI] [PubMed] [Google Scholar]
- Meléndez A, Tallóczy Z, Seaman M, Eskelinen EL, Hall DH, et al. Autophagy genes are essential for dauer development and life-span extension in C. elegans. Science. 2003;301:1387–91. doi: 10.1126/science.1087782. [DOI] [PubMed] [Google Scholar]
- Terman A, Brunk UT. Myocyte aging and mitochondrial turnover. Exp Gerontol. 2004;39:701–5. doi: 10.1016/j.exger.2004.01.005. [DOI] [PubMed] [Google Scholar]
- Wu XJ, Song B, Jin XY, Zhang JH. Effects of sense tankyrase transfection on smooth muscle cells of corpus cavernosum in rat. Arch Androl. 2006;52:111–6. doi: 10.1080/01485010500315727. [DOI] [PubMed] [Google Scholar]
- Mizushima N. Methods for monitoring autophagy. Int J Biochem Cell Biol. 2004;36:2491–502. doi: 10.1016/j.biocel.2004.02.005. [DOI] [PubMed] [Google Scholar]
- Rouschop KM, Wouters BG. Regulation of autophagy through multiple independent hypoxic signaling pathways. Curr Mol Med. 2009;9:417–24. doi: 10.2174/156652409788167131. [DOI] [PubMed] [Google Scholar]
- Klionsky DJ, Meijer AJ, Codogno P.Autophagy and p70S6 kinase Autophagy 2005159–60.discussion 60–1. [DOI] [PubMed] [Google Scholar]
- Smith S, de Lange T. Cell cycle dependent localization of the telomeric PARP, tankyrase, to nuclear pore complexes and centrosomes. J Cell Sci. 1999;112(Pt 21):3649–56. doi: 10.1242/jcs.112.21.3649. [DOI] [PubMed] [Google Scholar]
- Seimiya H, Smith S. The telomeric poly(ADP-ribose) polymerase, tankyrase 1, contains multiple binding sites for telomeric repeat binding factor 1 (TRF1) and a novel acceptor, 182-kDa tankyrase-binding protein (TAB182) J Biol Chem. 2002;277:14116–26. doi: 10.1074/jbc.M112266200. [DOI] [PubMed] [Google Scholar]
- Zhang J, Liu T, Qin XC, Li WR, Cui WS, et al. Effects of Icariside II on intracavernosal pressure and systematic arterial blood pressure of rat and its mechanism. Chin J Androl. 2010;24:19–23. [Google Scholar]
- Ma RC, So WY, Yang X, Yu LW, Kong AP, et al. Erectile dysfunction predicts coronary heart disease in type 2 diabetes. J Am Coll Cardiol. 2008;51:2045–50. doi: 10.1016/j.jacc.2008.02.051. [DOI] [PubMed] [Google Scholar]
- Di Donna S, Mamchaoui K, Cooper RN, Seigneurin-Venin S, Tremblay J, et al. Telomerase can extend the proliferative capacity of human myoblasts, but does not lead to their immortalization. Mol Cancer Res. 2003;1:643–53. [PubMed] [Google Scholar]
- Liu Y, Schiff M, Czymmek K, Tallóczy Z, Levine B, et al. Autophagy regulates programmed cell death during the plant innate immune response. Cell. 2005;121:567–77. doi: 10.1016/j.cell.2005.03.007. [DOI] [PubMed] [Google Scholar]
- Kabeya Y, Mizushima N, Ueno T, Yamamoto A, Kirisako T, et al. LC3, a mammalian homologue of yeast Apg8p, is localized in autophagosome membranes after processing. EMBO J. 2000;19:5720–8. doi: 10.1093/emboj/19.21.5720. [DOI] [PMC free article] [PubMed] [Google Scholar]
- Schmelzle T, Hall MN. TOR, a central controller of cell growth. Cell. 2000;103:253–62. doi: 10.1016/s0092-8674(00)00117-3. [DOI] [PubMed] [Google Scholar]
- The Science News Staff. Breakthrough of the year. Areas to watch in 2005. Science 20043062014. [DOI] [PubMed]
- Maiuri MC, Criollo A, Kroemer G. Crosstalk between apoptosis and autophagy within the Beclin 1 interactome. EMBO J. 2010;29:515–6. doi: 10.1038/emboj.2009.377. [DOI] [PMC free article] [PubMed] [Google Scholar]
- Meijer AJ, Codogno P. Regulation and role of autophagy in mammalian cells. Int J Biochem Cell Biol. 2004;36:2445–62. doi: 10.1016/j.biocel.2004.02.002. [DOI] [PubMed] [Google Scholar]
- Itakura E, Mizushima N. Atg14 and UVRAG: mutually exclusive subunits of mammalian Beclin 1-PI3K complexes. Autophagy. 2009;5:534–6. doi: 10.4161/auto.5.4.8062. [DOI] [PubMed] [Google Scholar]
- Aita VM, Liang XH, Murty VV, Pincus DL, Yu W, et al. Cloning and genomic organization of beclin 1, a candidate tumor suppressor gene on chromosome 17q21. Genomics. 1999;59:59–65. doi: 10.1006/geno.1999.5851. [DOI] [PubMed] [Google Scholar]
- Yue Z, Horton A, Bravin M, DeJager PL, Selimi F, et al. A novel protein complex linking the delta 2 glutamate receptor and autophagy: implications for neurodegeneration in lurcher mice. Neuron. 2002;35:921–33. doi: 10.1016/s0896-6273(02)00861-9. [DOI] [PubMed] [Google Scholar]
- Pattingre S, Tassa A, Qu X, Garuti R, Liang XH, et al. Bcl-2 antiapoptotic proteins inhibit Beclin 1-dependent autophagy. Cell. 2005;122:927–39. doi: 10.1016/j.cell.2005.07.002. [DOI] [PubMed] [Google Scholar]
- Lekmine F, Uddin S, Sassano A, Parmar S, Brachmann SM, et al. Activation of the p70 S6 kinase and phosphorylation of the 4E-BP1 repressor of mRNA translation by type I interferons. J Biol Chem. 2003;278:27772–80. doi: 10.1074/jbc.M301364200. [DOI] [PubMed] [Google Scholar]
- Stolovich M, Tang H, Hornstein E, Levy G, Cohen R, et al. Transduction of growth or mitogenic signals into translational activation of TOP mRNAs is fully reliant on the phosphatidylinositol 3-kinase-mediated pathway but requires neither S6K1 nor rpS6 phosphorylation. Mol Cell Biol. 2002;22:8101–13. doi: 10.1128/MCB.22.23.8101-8113.2002. [DOI] [PMC free article] [PubMed] [Google Scholar]


