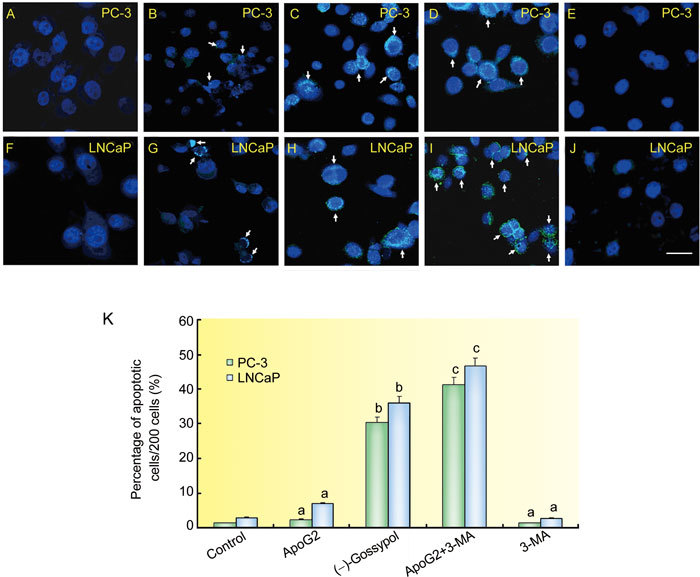
Figure 3.

Apoptotic cell death in PC-3 (A–E) and LNCaP (F–J) cells. The photomicrographs show controls (A, F), 10 mg L−1 ApoG2 (B, G), 10 mg L−1 (−)-gossypol (C, H), 10 mmol L−1 3-MA+10 mg L−1 ApoG2 (D, I) and 3-MA (E, J) treated PC-3 and LNCaP cells. Bar = 20 μm. The TUNEL-positive nuclei are visualized in cyan, while Hochest33342-stained normal cell nuclei are visualized in blue. Cells in control exhibited only blue nuclei while the ApoG2 treatment produced a few TUNEL-positive nuclei (arrows). The histogram (K) represents the percentage (mean ± SD) of apoptotic nuclei (y-axis) per 200 cells for the conditions listed (x-axis). aP > 0.05, bP < 0.01, compared with control, cP < 0.01, compared with ApoG2.
