
Figure 4.
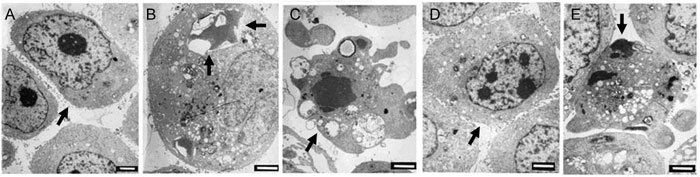
Ultrastructure of PC-3 cells treated with ApoG2 or (−)-gossypol. (A): DMSO-treated PC-3 cells at 24 h; (B): PC-3 cells treated with 10 mg L−1 ApoG2 at 24 h; (C): PC-3 cells treated with 10 mg L−1 ApoG2 at 72 h. (D): PC-3 cells treated with DMSO at 72 h; (E): PC-3 cells treated with 10 mg L−1(−)-gossypol at 24 h. Arrows indicate normal cells (A and D), autophagosome (B), apoptosis cells (C and E); Bars = 1 μm.