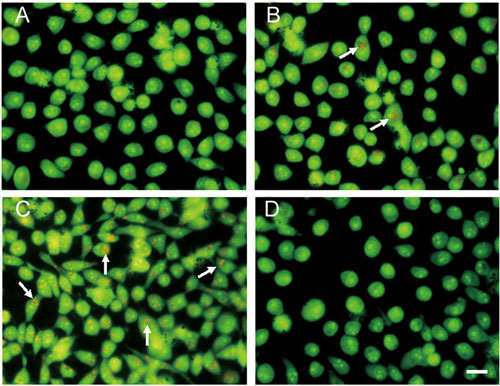
Figure 5.

Indication of autophagy by acridine orange staining. (A): PC-3 cells treated with DMSO at 48 h; (B): PC-3 cells treated with 10 mg L−1 ApoG2 at 24 h; (C): PC-3 cells treated with 10 mg L−1 ApoG2 at 96 h; (D): PC-3 cells treated with 10 mg L−1 (−)-gossypol at 72 h. Arrows indicate acidic vesicular organelles. Bar = 20 μm.
