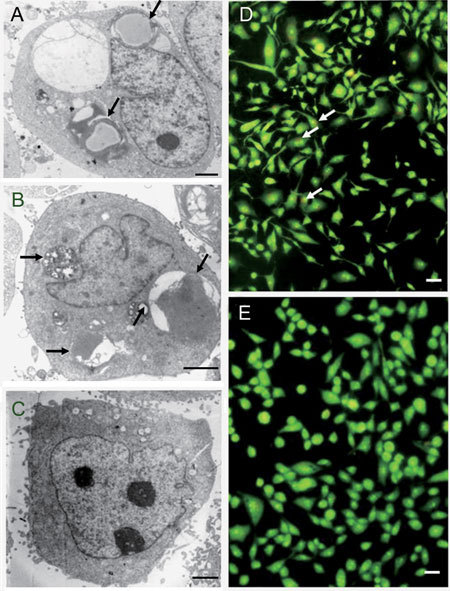
Figure 6.

ApoG2-induced autophagy in LNCaP cells. (A): LNCaP cells treated with 10 mg L−1 ApoG2 at 24 h with arrows to indicate the autophagosome-like structures; (B): LNCaP cells treated with 10 mg L−1 ApoG2 at 72 h with arrows to indicate the autophagosome-like structures; (C): LNCaP cells treated with DMSO at 72h. (D): Acridine orange staining of LNCaP cells treated with 10.0 mg L−1 ApoG2 at 24 h; (E): Acridine orange staining of LNCaP cells treated with DMSO at 24 h. (A)–(C): Bars = 1 μm. (D)–(E): Bars = 10 μm.
