
Figure 1.
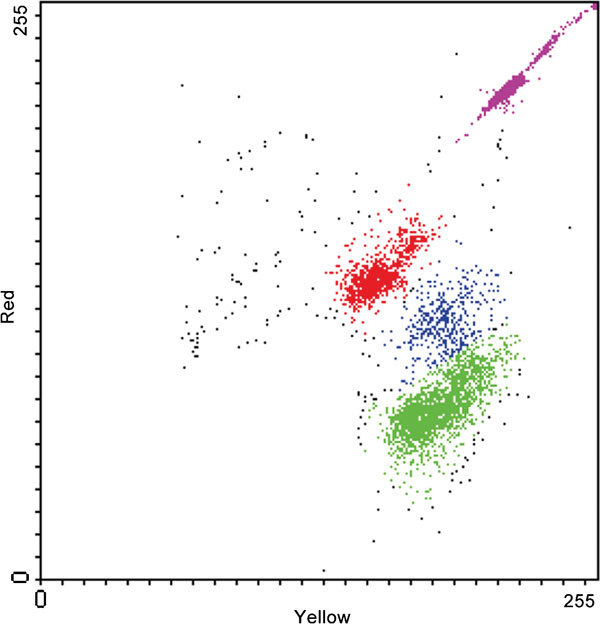
Color dot plot representing the simultaneous evaluation of viability (SYBR 141/PI staining) and cell concentration. Viable spermatozoa are indicated by green color, dead ones are indicated by red color and dying spermatozoa are indicated by blue color. Fluorescent microbeads are indicated by magenta color. PI, propidium iodide.