
Figure 5.
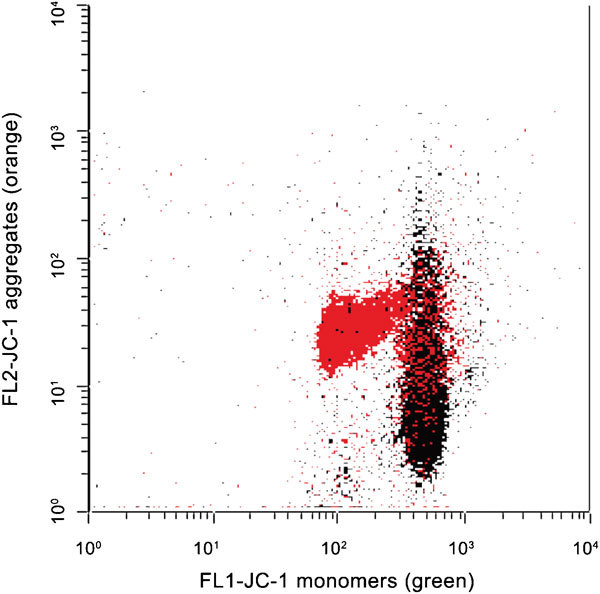
Mitochondrial membrane potential, evaluated by JC-1. Color dot plot shows a raw semen sample before (red) and after (black) freeze killing (plunging the semen aliquot into liquid nitrogen). List mode files were merged with FCSExpress software (version 3.0; De Novo Software, Los Angeles, CA, USA). JC-1, 5,5′,6,6′-tetrachloro-1,1′,3,3′-tetraethylbenzimidazolyl-carbocyanine iodide.