
Figure 3.
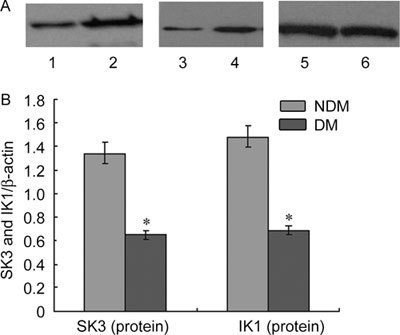
(A): The expression of SK3 and IK1 protein in rats' corpus cavernosum. Proteins were normalised for loading with β-actin, Lane 1: IK1 in DM group; Lane 2: IK1 in NDM group; Lane 3: SK3 in DM group; Lane 4: SK3 in NDM group; Lane 5, 6: β-actin. (B): SK3, IK1 and β-actin bands were subject to densitometry on an Eastman Kodak Co. Image Station 440 CF, and the ratio of SK3 and β-actin, IK1 and β-actin was plotted for quantification of the blots. The data were expressed as mean ± SD (NDM group: n =10, DM group: n = 20). All results are representative of three independent experiments. *P < 0.05; compared with the control group. DM, diabetes mellitus group: NDM, control group.