Figure 1.

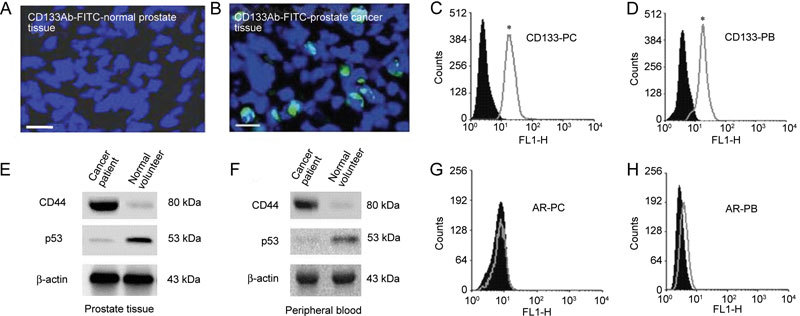
Characterization of prostate cancer stem cells. (A) and (B): The immunolabelling of CD133 in normal and prostate cancer tissues, which was stained with FITC (green). Nuclei were labelled with DAPI (blue). Scale bars = 50 μm. (C) and (D): The purity of CD133+ cells isolated from the prostate cancer tissue (PC) and the peripheral blood (PB). (E) and (F): The expression profiles of CD44, p53 and β-actin in the prostate tissue and peripheral blood of both control and prostate cancer patients. (G) and (H): The expression profile of androgen receptor (AR) in CD133+ cells isolated from prostate cancer tissues and the peripheral blood. In each case, the filled histogram represents an isotype-matched IgG control antibody. Histograms were analyzed with the intensity of the detected signal on the x-axis and the number of counts (cells) on the y-axis. Experiments were performed for each antibody on at least five separate occasions (*P < 0.05, compared with the respective IgG control).
