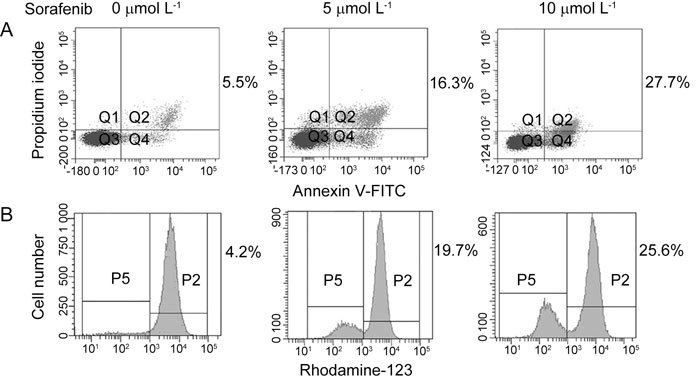
Figure 2.

Induction of apoptosis and mitochondrial depolarization in PC-3 cells in response to sorafenib treatment. (A): PC-3 cells were exposed to the drug at the indicated concentration for 20 h, stained with Annexin-FITC V and propidium iodide (PI) and analyzed by flow cytometry. Numbers represent the percentage of cells stained with Annexin V alone (Q4) and double stained with Annexin-V and PI (Q2). (B): PC-3 cells stained with Rhodamine-123 and analyzed by flow cytometry. Numbers represent the percentage of cells displaying diminution of mitochondrial transmembrane potential. P, percentage. Q, quantitative.
