
Figure 1.
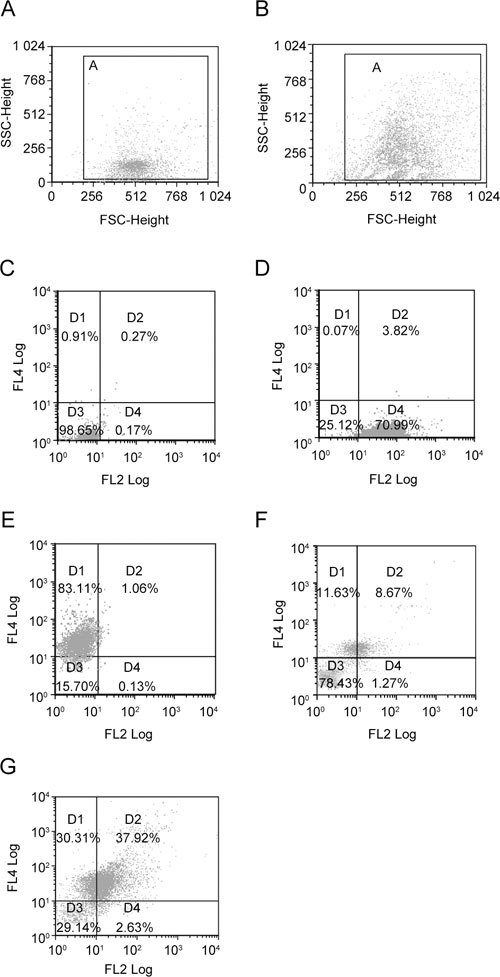
Representative forward (FSC) and side scatter (SSC) dot plots of unstained spermatozoa from control (A) and heat-treated (B) mice. Gate 'A' in dot plots was selected to exclude debris before flow cytometric analysis. In control (A), spermatozoa were mostly concentrated in the lower region of gate 'A', whereas in heat-treated group (B), an upward shift is apparent. Panels C–E show the quadrant limits set with unstained (C), Annexin V–PE-positive (D) and 7-AAD-positive (E) controls. Panels F and G show four different subpopulations of stained spermatozoa in four different quadrants (D1–D4) in control (F) and heat-treated (G) groups. D1, Annexin V−/7-AAD+ (dead spermatozoa); D2, Annexin V+/7-AAD+ (late apoptotic spermatozoa); D3, Annexin V−/7-AAD− (live spermatozoa); and D4, Annexin V+/7-AAD− (early apoptotic spermatozoa). The percentages shown in the quadrants represent values from a single control and heat-treated mouse.