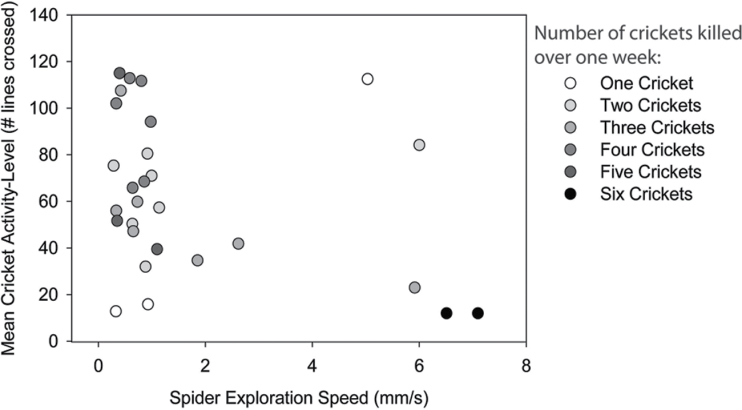
Figure 3.
An interaction plot depicting the simultaneous effects of cricket and spider locomotor behavior on the number of prey killed over a 1-week mesocosm experiment. Cricket behavior (y axis) is an activity level measure, as estimated by the number of lines individuals’ crossed over a 5-min period in an experimental arena. Individual data points represent the average activity levels of 6 crickets that constituted the prey population in each mesocosm. Spider behavior (x axis) is an estimate of exploration speed, as estimated by individuals’ time to scale an 8.5-cm vial. Data points represent the behavior of 1 spider that served as the single predator in each mesocosm trial.

