
Figure 2.
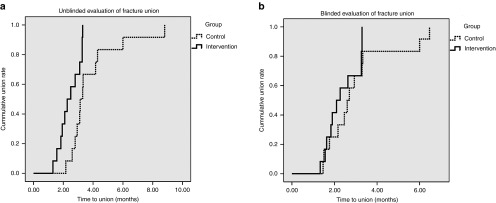
Blinded and unblinded evaluation of radiographic analysis: Kaplan Meier Curve. Time to radiographic union of the fractures in the intervention (straight line) and the control (dotted line) groups as determined by (a) unblinded and (b) blinded evaluators. The data are presented in Kaplan Meier curves as cumulative union (ratio) over time (months).